Figure 1 shows an experiment used to investigate the harmonics of a vibrating steel wire. The wire, of fixed length LLL, is held under tension by a mass mmm suspended over a pulley. The fundamental frequency fff is measured for various masses.
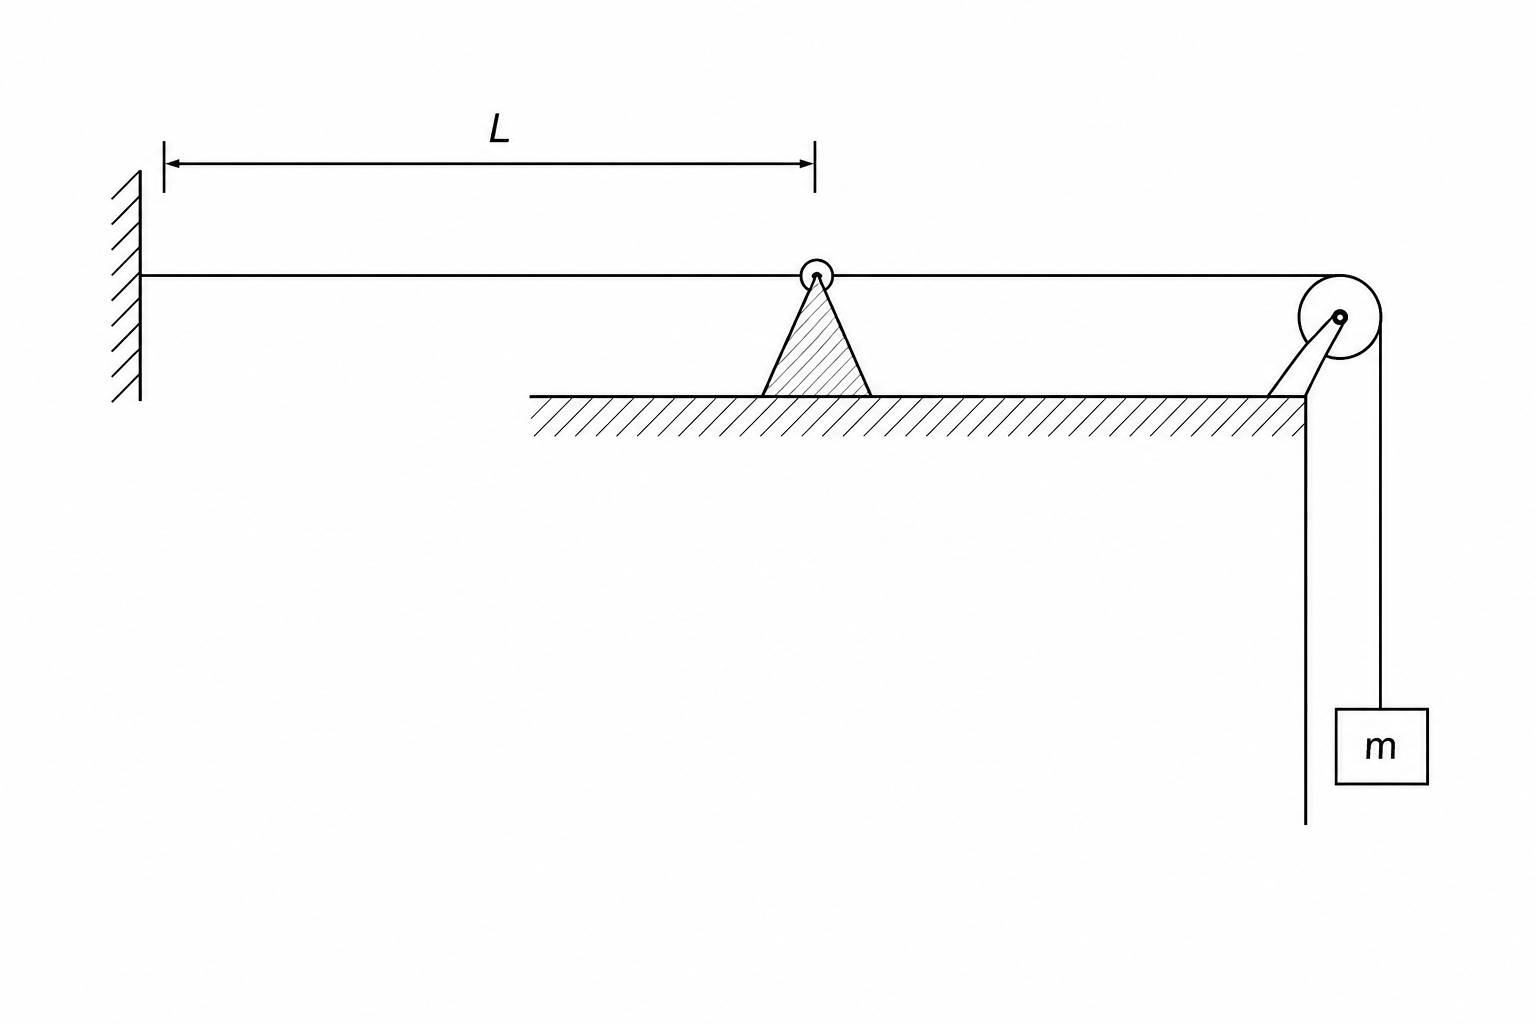
Table 1 shows the experimental data.
Table 1
| m/kgm / \text{kg}m/kg | f/Hzf / \text{Hz}f/Hz |
|---|---|
| 0.40 | 120 |
| 0.90 | 180 |
| 1.60 | 240 |
Show that the data are consistent with the relationship f∝Tf \propto \sqrt{T}f∝T, where TTT is the tension.
The steel wire has a density of 7800 kg m−37800 \text{ kg m}^{-3}7800 kg m−3 and a uniform diameter of 4.0×10⁻⁴ m4.0 \times 10^{-4} \text{ m}4.0×10⁻⁴ m. Determine the length LLL of the wire.
At much higher tensions, the wire begins to stretch significantly, increasing its length and reducing its diameter. Explain how the measured frequency would differ from the frequency predicted by the linear relationship in part 1.