Question 7
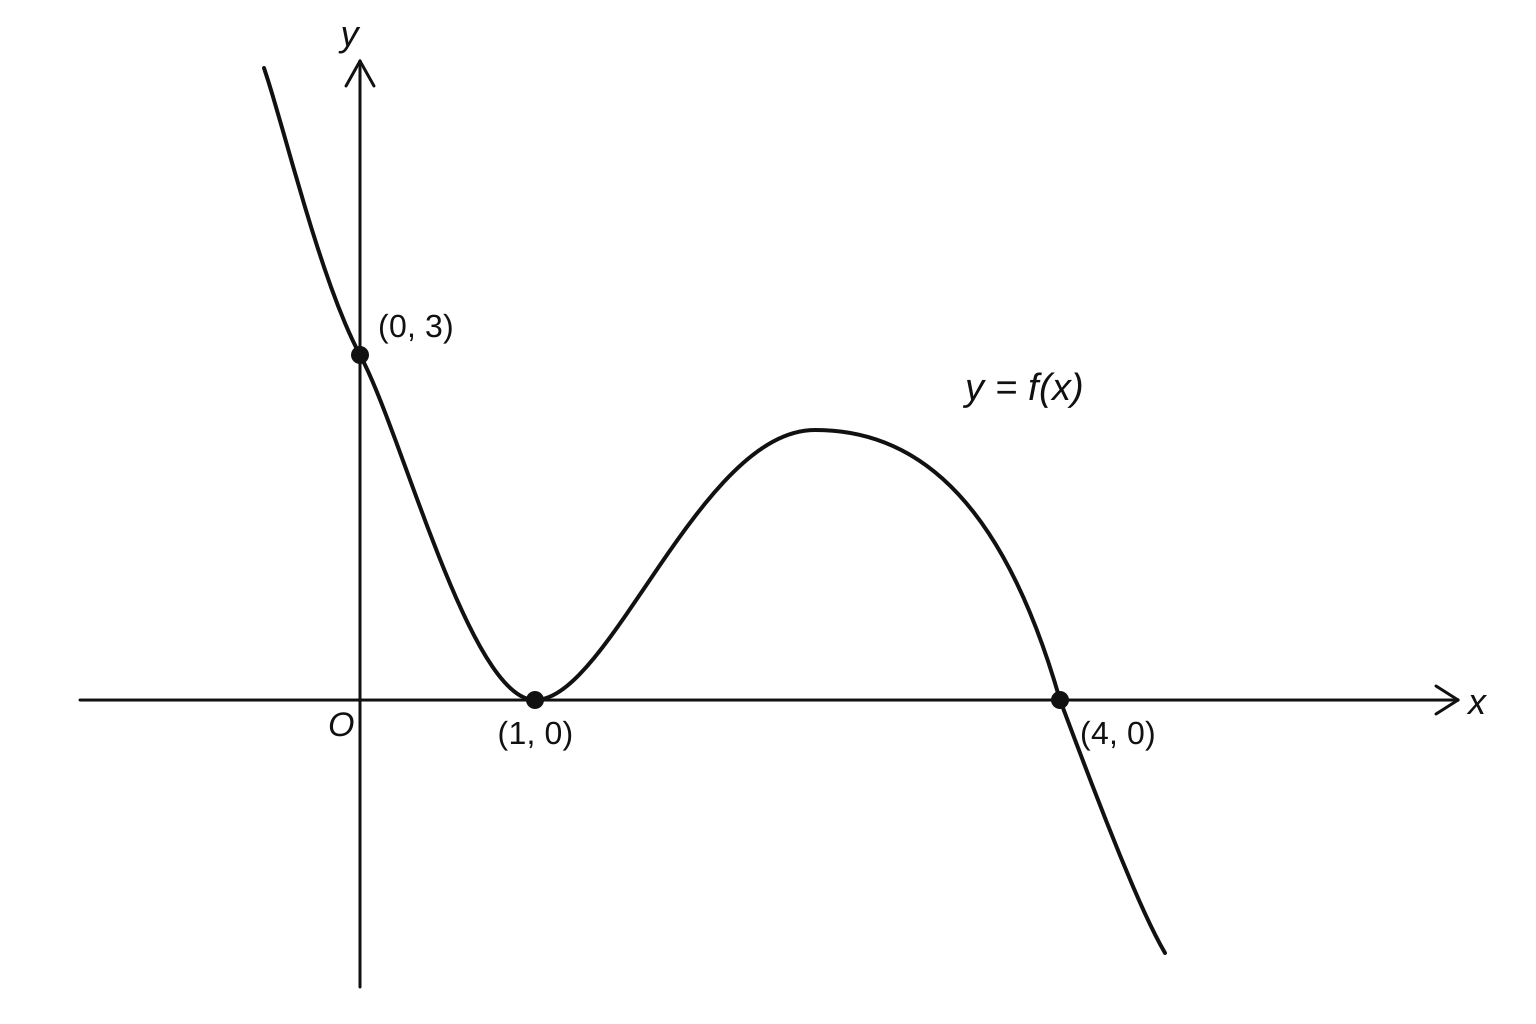
Figure 1 shows a sketch of the curve with equation y=f(x)y = f(x)y=f(x). The curve passes through the points (0,3)(0, 3)(0,3) and (4,0)(4, 0)(4,0) and touches the xxx-axis at the point (1,0)(1, 0)(1,0).
a.[3]
On a separate diagram, sketch the curve with equation y=f(x+1)y = f(x + 1)y=f(x+1). Show clearly the coordinates of all the points at which the curve meets the axes.
b.[3]
On a separate diagram, sketch the curve with equation y=2f(x)y = 2f(x)y=2f(x). Show clearly the coordinates of all the points at which the curve meets the axes.
c.[3]
On a separate diagram, sketch the curve with equation y=f(12x)\displaystyle y = f(\frac{1}{2}x)y=f(21x). Show clearly the coordinates of all the points at which the curve meets the axes.
Algebra and Functions 2 Questions
14 exam-style questions on Edexcel A Level Old Maths Algebra and Functions 2. Each one has a worked solution and a mark scheme showing where the marks go.