

What you'll learn
- How the gradient of a curve changes as you move from left to right.
- How increasing, decreasing and stationary behaviour appears on a gradient graph.
- How to estimate and sketch the gradient function from a given curve.
- How corners, cusps and vertical tangents affect the gradient function.
From a curve to its gradient
You already know that the gradient of a straight line measures its steepness:
gradient=change in ychange in x\text{gradient}=\frac{\text{change in }y}{\text{change in }x}gradient=change in xchange in yA curve does not usually have one constant gradient. Instead, its gradient changes as xxx changes.
At a particular point, the gradient of a curve is the gradient of the tangent at that point. A tangent is a straight line that follows the direction of the curve locally.
The gradient function
If a curve has equation y=f(x)y=f(x)y=f(x), its gradient function is written f′(x)f'(x)f′(x) or dydx\dfrac{dy}{dx}dxdy. Its value at each xxx-coordinate is the gradient of the tangent to y=f(x)y=f(x)y=f(x) there.
The graph of f′(x)f'(x)f′(x) is therefore a new graph. Its horizontal coordinate is still xxx, but its vertical coordinate records the gradient of the original curve, not the original height.
Copying the original heights
A point (a,b)(a,b)(a,b) on y=f(x)y=f(x)y=f(x) does not usually give the point (a,b)(a,b)(a,b) on y=f′(x)y=f'(x)y=f′(x). The two graphs share xxx-coordinates, but their vertical coordinates represent different quantities.
The sign of the gradient
The most important first step is deciding whether the curve is increasing or decreasing.
Increasing sections
A function is increasing where its value rises as you move from left to right. Its tangent gradients are positive, so:
f′(x)>0f'(x)>0f′(x)>0The graph of f′(x)f'(x)f′(x) must lie above the horizontal axis on that interval.
Decreasing sections
A function is decreasing where its value falls as you move from left to right. Its tangent gradients are negative, so:
f′(x)<0f'(x)<0f′(x)<0The graph of f′(x)f'(x)f′(x) must lie below the horizontal axis on that interval.
Horizontal sections
Where the tangent is horizontal, its gradient is zero:
f′(x)=0f'(x)=0f′(x)=0The gradient graph therefore meets the horizontal axis at that xxx-coordinate.
Position of the gradient graph
The gradient graph is above the axis when the original curve is increasing, below the axis when it is decreasing, and on the axis when the original curve has a horizontal tangent.
Using increasing and decreasing intervals
Suppose a smooth curve is increasing for x<−2x<-2x<−2, decreasing for −2<x<3-2<x<3−2<x<3, and increasing again for x>3x>3x>3. It has horizontal tangents at x=−2x=-2x=−2 and x=3x=3x=3.
-
On x<−2x<-2x<−2, the curve is increasing, so sketch f′(x)f'(x)f′(x) above the horizontal axis.
-
At x=−2x=-2x=−2, the tangent is horizontal, so the gradient graph passes through (−2,0)(-2,0)(−2,0).
-
On −2<x<3-2<x<3−2<x<3, the curve is decreasing, so sketch f′(x)f'(x)f′(x) below the horizontal axis.
-
At x=3x=3x=3, the tangent is horizontal, so the gradient graph passes through (3,0)(3,0)(3,0).
-
For x>3x>3x>3, the curve is increasing again, so sketch f′(x)f'(x)f′(x) above the horizontal axis.
Stationary points
A stationary point is a point where the gradient is zero. It may be a local maximum, a local minimum or a stationary point of inflection.
Local maximum
At a smooth local maximum, the curve normally changes from increasing to decreasing. Therefore f′(x)f'(x)f′(x) changes:
positive → 0 → negative\text{positive}\ \to\ 0\ \to\ \text{negative}positive → 0 → negativeThe gradient graph crosses the horizontal axis from above to below.
Local minimum
At a smooth local minimum, the curve normally changes from decreasing to increasing. Therefore f′(x)f'(x)f′(x) changes:
negative → 0 → positive\text{negative}\ \to\ 0\ \to\ \text{positive}negative → 0 → positiveThe gradient graph crosses the horizontal axis from below to above.
Stationary point of inflection
At a stationary point of inflection, the tangent is horizontal but the curve does not change between increasing and decreasing. For example, it may be increasing on both sides.
In that case, f′(x)=0f'(x)=0f′(x)=0, but the sign of f′(x)f'(x)f′(x) does not change. The gradient graph touches the horizontal axis and turns back without crossing it.
Classifying a stationary point
Look at the sign of f′(x)f'(x)f′(x) on either side: positive to negative gives a local maximum, negative to positive gives a local minimum, and no sign change suggests a stationary point of inflection.
Steepness and the size of the gradient
The sign of f′(x)f'(x)f′(x) tells you the direction of the curve. The magnitude of f′(x)f'(x)f′(x) tells you how steep it is.
- A steep upward section has a large positive gradient.
- A shallow upward section has a small positive gradient.
- A steep downward section has a negative gradient with large magnitude.
- A shallow downward section has a negative gradient close to zero.
For example, a gradient of −8-8−8 represents a steeper downward slope than a gradient of −2-2−2. Although −8-8−8 is lower on the gradient graph, its magnitude is greater.
Misreading negative gradients
A very steep downward section produces a large negative value of f′(x)f'(x)f′(x), not a value close to zero. Gradients close to zero represent nearly horizontal tangents.
Plotting estimated tangent gradients
Suppose tangent gradients are estimated from a curve as follows:
- at x=−2x=-2x=−2, the gradient is about 3;
- at x=−1x=-1x=−1, the gradient is about 1;
- at x=0x=0x=0, the gradient is 0;
- at x=1x=1x=1, the gradient is about −2-2−2.
-
Convert each estimate into a point on the gradient graph: (−2,3)(-2,3)(−2,3), (−1,1)(-1,1)(−1,1), (0,0)(0,0)(0,0) and (1,−2)(1,-2)(1,−2).
-
Notice that the gradients decrease as xxx increases, so the gradient graph should generally move downwards through these points.
-
Join the points with a smooth curve if the original curve is smooth. The sketch crosses the horizontal axis at x=0x=0x=0, matching the horizontal tangent there.
A complete example
Consider the curve:
f(x)=x3−3xf(x)=x^3-3xf(x)=x3−3xIt has a local maximum at x=−1x=-1x=−1 and a local minimum at x=1x=1x=1. Its gradient function is:
f′(x)=3x2−3f'(x)=3x^2-3f′(x)=3x2−3The diagrams show how features of the original cubic correspond to features of its gradient parabola.
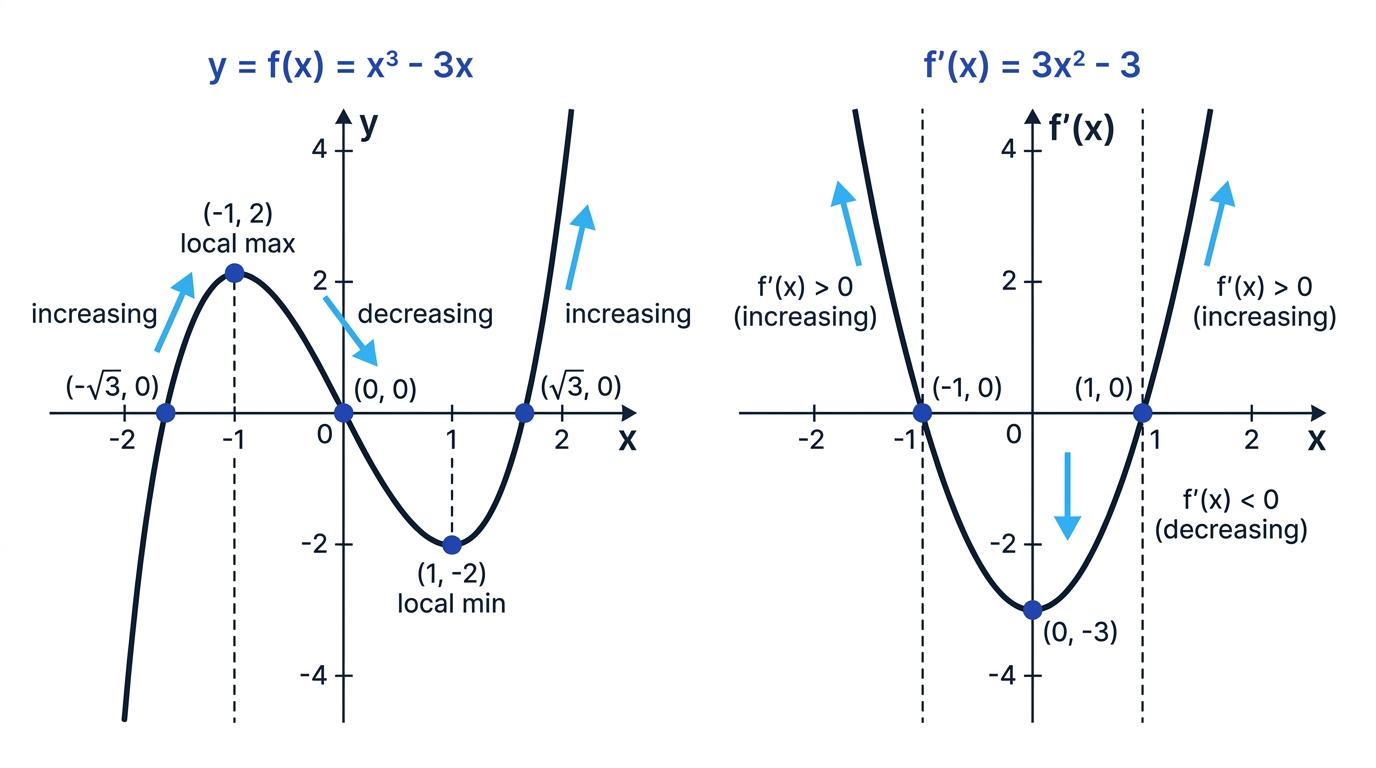
Sketching the gradient of a cubic
-
Find where the original curve has horizontal tangents. These occur at x=−1x=-1x=−1 and x=1x=1x=1, so the gradient graph has zeros at (−1,0)(-1,0)(−1,0) and (1,0)(1,0)(1,0).
-
For x<−1x<-1x<−1, the cubic is increasing, so f′(x)>0f'(x)>0f′(x)>0. The gradient graph lies above the axis.
-
For −1<x<1-1<x<1−1<x<1, the cubic is decreasing, so f′(x)<0f'(x)<0f′(x)<0. The gradient graph lies below the axis.
-
For x>1x>1x>1, the cubic is increasing again, so f′(x)>0f'(x)>0f′(x)>0. The gradient graph returns above the axis.
-
The downward slope is steepest around x=0x=0x=0. In fact, f′(0)=−3f'(0)=-3f′(0)=−3, giving the vertex (0,−3)(0,-3)(0,−3).
-
Join the information smoothly. The result is an upward-opening parabola crossing the axis at x=−1x=-1x=−1 and x=1x=1x=1.
How to sketch from a graph
When no equation is given, you are not expected to calculate an exact derivative. Instead, estimate the changing tangent gradients.
A reliable method
-
Mark every point where the original curve has a horizontal tangent. These give zeros of the gradient function.
-
Divide the curve into increasing and decreasing intervals. This tells you where the gradient graph is positive or negative.
-
Compare steepness at several useful xxx-coordinates. Plot approximate gradient values if the scale allows you to do so.
-
Consider whether the gradients themselves are increasing or decreasing. This helps determine whether the gradient graph slopes upwards or downwards.
-
Join the information with a smooth curve, provided the original curve is smooth.
Gradients can themselves change
If the tangents to f(x)f(x)f(x) are becoming more positive, then f′(x)f'(x)f′(x) is increasing. If they are becoming more negative, then f′(x)f'(x)f′(x) is decreasing.
Points where the derivative may not exist
A curve is differentiable at a point if it has a single finite gradient there.
At a sharp corner or cusp, there is no unique tangent gradient. At a vertical tangent, the gradient is not finite. In these cases, f′(x)f'(x)f′(x) is undefined at that xxx-coordinate, so your gradient graph should contain a gap or another clear indication that the point is excluded.
Do not force a smooth derivative
A continuous original graph does not guarantee that its gradient function exists everywhere. Corners, cusps and vertical tangents can make f′(x)f'(x)f′(x) undefined.
In the exam
-
Find the horizontal tangents first and transfer their xxx-coordinates to zeros of the gradient graph.
-
Use increasing and decreasing intervals to decide whether f′(x)f'(x)f′(x) belongs above or below the axis.
-
Compare the steepness of the original curve at several points; do not sketch the derivative using signs alone.
-
Keep the original xxx-coordinates, but remember that the new vertical coordinates are gradients.
-
Check whether the original curve is smooth before joining the derivative sketch smoothly.
Check yourself
-
What happens to the sign of f′(x)f'(x)f′(x) as f(x)f(x)f(x) passes through a smooth local minimum?
-
How would a stationary point of inflection appear on the graph of f′(x)f'(x)f′(x)?
-
If a curve has a sharp corner at x=4x=4x=4, what should happen to its gradient graph there?
