

What you'll learn
- How to translate a real situation into a probability model.
- How assumptions such as independence and equal likelihood affect calculations.
- How to critique a model rather than accepting its answer automatically.
- How more realistic assumptions are likely to change a prediction.
What is a probability model?
A model is a simplified mathematical description of a real situation. A probability model assigns probabilities to possible outcomes so that you can make predictions when the outcome is uncertain.
For example, a manufacturer might model whether a component is defective, or a transport company might model whether a train is delayed.
Probability model
A probability model identifies the possible outcomes of a process and assigns a probability to each outcome. Every probability must be between 0 and 1, and the probabilities of all possible outcomes must add to 1.
A model is not a perfect copy of reality. It deliberately leaves out some detail so that the situation becomes manageable. The aim is to include the features that matter most.
Basic probability rules
If AAA is an event, then:
0≤P(A)≤1.0\le P(A)\le 1.0≤P(A)≤1.Its complement, written A′A'A′, is the event that AAA does not happen:
P(A′)=1−P(A).P(A')=1-P(A).P(A′)=1−P(A).If events AAA and BBB cannot happen together, they are mutually exclusive, so:
P(A or B)=P(A)+P(B).P(A\text{ or }B)=P(A)+P(B).P(A or B)=P(A)+P(B).For a sequence of events, probabilities along the branches of a probability tree are multiplied. Probabilities for different routes leading to the required result are then added.
Finding a probability from a simple model
A machine produces a defective component with probability P(D)=0.04P(D)=0.04P(D)=0.04. Model successive components as independent. Find the probability that at least one of the next three components is defective.
-
Use the complement. “At least one defective” is the complement of “all three satisfactory”.
-
The probability that one component is satisfactory is:
P(D′)=1−0.04=0.96.P(D')=1-0.04=0.96.P(D′)=1−0.04=0.96. -
Under the independence assumption, multiply the three probabilities:
P(all satisfactory)=0.963=0.884736.P(\text{all satisfactory})=0.96^3=0.884736.P(all satisfactory)=0.963=0.884736. -
Therefore:
P(at least one defective)=1−0.884736=0.115264.P(\text{at least one defective}) =1-0.884736 =0.115264.P(at least one defective)=1−0.884736=0.115264.
Turning reality into a model
Probability modelling usually follows a cycle.
1. Identify the outcomes and events
Decide what the model must predict. An outcome is one possible result, while an event is a collection of one or more outcomes.
For a delivery, the outcomes might be “on time” and “late”. If more detail is needed, the outcomes might instead be “early”, “on time”, “up to 15 minutes late” and “more than 15 minutes late”.
The categories should cover every possibility and should not overlap.
2. Assign probabilities
Probabilities may come from:
- known physical features, such as the faces of a fair die;
- observed relative frequencies from data;
- previous studies or records;
- assumptions made to simplify the situation.
If an event occurred xxx times in nnn relevant observations, its probability may be estimated by the relative frequency
P(A)≈xn.P(A)\approx\frac{x}{n}.P(A)≈nx.Building a model from data
In 250 recorded journeys, a bus arrived more than five minutes late on 45 occasions. Estimate the probability that it will be more than five minutes late tomorrow.
-
Treat the historical journeys as observations of the event L=L=L= “more than five minutes late”.
-
Calculate the relative frequency:
P(L)≈45250=0.18.P(L)\approx\frac{45}{250}=0.18.P(L)≈25045=0.18. -
The model therefore predicts an 18% chance of a delay longer than five minutes, provided the recorded journeys are representative of tomorrow’s conditions.
Treating an estimate as exact
A probability calculated from observed data is an estimate, not a permanent fact. A different sample, a timetable change or different weather conditions could produce a different value.
3. Use the model
Once the probabilities and relationships between events have been chosen, use probability rules, tree diagrams or conditional probability to calculate the required prediction.
4. Interpret and review
Translate the mathematical answer back into the original context. Then ask whether the model’s assumptions were reasonable and whether the answer agrees with observations.
The modelling cycle
A probability calculation is only one part of modelling: formulate the model, calculate a result, interpret it, compare it with reality and refine the assumptions if necessary.
Assumptions in probability models
An assumption is a statement accepted as true when constructing the model, even though it may only be approximately true in reality.
Common assumptions include:
- outcomes are equally likely;
- repeated events are independent;
- probabilities remain constant over time;
- observations are representative of the relevant population;
- every important outcome has been included;
- people, objects or trials behave in the same way.
Equal likelihood
Outcomes are equally likely if they have the same probability. For example, modelling a die by assigning probability 16\frac1661 to each face assumes that the die is fair.
You should not use
P(A)=number of favourable outcomestotal number of outcomesP(A)=\frac{\text{number of favourable outcomes}}{\text{total number of outcomes}}P(A)=total number of outcomesnumber of favourable outcomesunless the individual outcomes being counted are equally likely.
Questioning equal likelihood
A spinner is divided into four sectors, but the sectors have different angles. A student assigns probability 14\frac1441 to each sector.
-
The student has assumed that the four labelled outcomes are equally likely merely because there are four of them.
-
For a fair spinner, a sector’s probability should normally be proportional to its angle. Sectors with larger angles should therefore have larger probabilities.
-
The model will overestimate the probability of smaller sectors and underestimate the probability of larger sectors. Using the sector angles would produce a more realistic model.
Independence
Two events AAA and BBB are independent if the occurrence of one does not change the probability of the other. Algebraically,
P(A∩B)=P(A)P(B).P(A\cap B)=P(A)P(B).P(A∩B)=P(A)P(B).Repeated selections with replacement may reasonably be modelled as independent. Selections without replacement usually are not independent because the contents of the population change after the first selection.
Conditional probability
The conditional probability P(B∣A)P(B\mid A)P(B∣A) is the probability that BBB occurs given that AAA has already occurred. If this differs from P(B)P(B)P(B), then AAA and BBB are not independent.
Comparing a simple model with a more realistic one
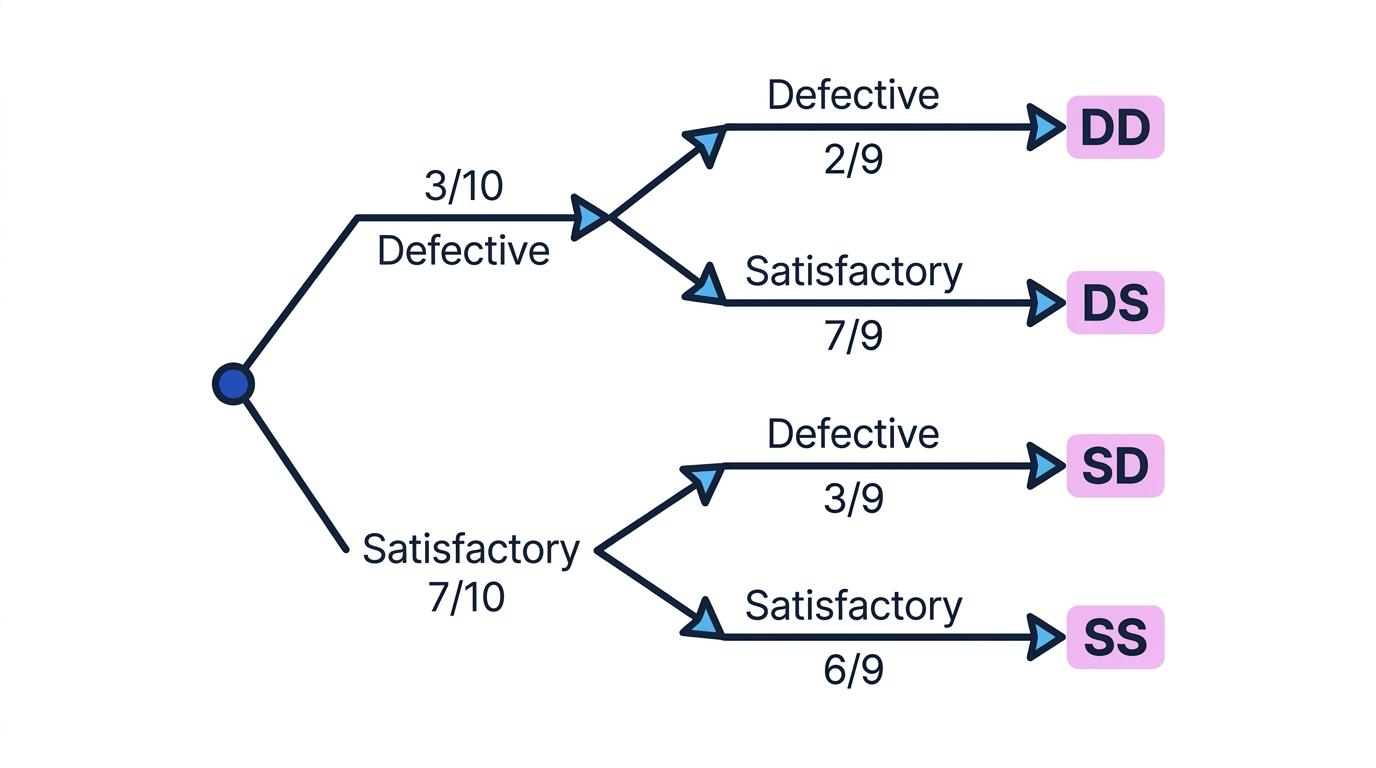
Suppose a batch contains 3 defective and 7 satisfactory components. Two components are selected. The tree below models selection without replacement, so the second set of probabilities depends on the first result.
Changing the independence assumption
Find the probability of selecting exactly one defective component, first using an independent model and then using the more realistic model without replacement.
-
An independent model keeps the defective probability at 310\frac3{10}103 for both selections:
P(exactly one defective)=P(DS)+P(SD)=310×710+710×310=2150.\begin{aligned} P(\text{exactly one defective}) &=P(DS)+P(SD)\\ &=\frac3{10}\times\frac7{10} +\frac7{10}\times\frac3{10}\\ &=\frac{21}{50}. \end{aligned}P(exactly one defective)=P(DS)+P(SD)=103×107+107×103=5021. -
Without replacement, the probabilities on the second selection change:
P(exactly one defective)=310×79+710×39=715.\begin{aligned} P(\text{exactly one defective}) &=\frac3{10}\times\frac7{9} +\frac7{10}\times\frac3{9}\\ &=\frac7{15}. \end{aligned}P(exactly one defective)=103×97+107×93=157. -
Compare the results:
715−2150=7150>0.\frac7{15}-\frac{21}{50} =\frac7{150}>0.157−5021=1507>0.The independent model underestimates the probability of exactly one defective component.
-
This direction is reasonable: after selecting a defective component without replacement, the second component is less likely to be defective. This makes a mixed pair more likely than the independent model predicts.
Small sampling fractions
If only a very small number of items is selected from a very large population, sampling without replacement changes the probabilities only slightly. Independence may then be a useful approximation.
Critiquing assumptions
To critique a model means to evaluate its strengths and limitations. It is not enough to say that an assumption is “unrealistic”; explain why it may fail and how that could affect the answer.
A strong critique has three parts:
- State the assumption.
- Explain why it may not hold in context.
- Describe the likely effect on the model’s prediction.
Critiquing a model of warranty claims
A company assumes that each appliance independently makes a warranty claim with probability ppp. Explain a possible weakness of this model.
-
The model assumes both independence and a constant claim probability for every appliance.
-
Appliances produced in the same factory batch may share a faulty component. Their claims could therefore be positively associated rather than independent.
-
The independent model may underestimate the chance of a large cluster of claims. A more realistic model could assign different defect probabilities to different batches or condition the probabilities on the production line.
Making assumptions more realistic
A refined model might:
- use different probabilities for different groups or conditions;
- use conditional probabilities instead of independence;
- allow probabilities to vary over time;
- sample more recent or more representative data;
- include an important outcome that was previously ignored.
More realism does not automatically make a model better. Extra detail may require more data, make calculations harder and introduce uncertain parameters. A useful model balances realism with simplicity.
Direction of change
A more realistic assumption does not always increase a probability. Decide which outcomes become more or less likely, then follow that change through the calculation.
Validating a model
To validate a model is to compare its predictions with real observations.
If a model predicts probability ppp for an event over nnn trials, you would expect roughly npnpnp occurrences in the long run. A discrepancy does not automatically prove that the model is wrong because random variation is expected. However, a large or repeated discrepancy may suggest that an assumption should be revised.
In the exam
- Define the events clearly and check that the probabilities are valid and exhaustive.
- State each modelling assumption in context, especially equal likelihood, independence and constant probabilities.
- When critiquing, explain why an assumption may fail and give the likely direction of its effect on the prediction.
- Use conditional probabilities when an earlier outcome changes a later probability.
- Interpret the final probability in context and avoid claiming that it guarantees what will happen.
Check yourself
- When is it valid to calculate a probability by counting favourable and total outcomes?
- Why are selections without replacement usually dependent?
- How would you critique the assumption that tomorrow’s weather has the same probability distribution as all days in a historical dataset?
