

What you'll learn
- How a function connects inputs to outputs and how this is represented by a graph.
- How to identify domains, ranges, intercepts, roots and turning points.
- How graphs can be used to solve equations and inequalities.
- How to interpret a graph in a mathematical or modelling context.
From functions to graphs
A function is a rule that assigns exactly one output to each permitted input. If the function is called fff, then f(x)f(x)f(x) means the output produced when the input is xxx.
For example, if
f(x)=x2−3,f(x)=x^2-3,f(x)=x2−3,then the input x=4x=4x=4 produces the output
f(4)=42−3=13.f(4)=4^2-3=13.f(4)=42−3=13.The graph of y=f(x)y=f(x)y=f(x) contains every coordinate pair (x,f(x))(x,f(x))(x,f(x)) allowed by the function.
Graph of a function
The graph of y=f(x)y=f(x)y=f(x) is the set of all points with coordinates (x,f(x))(x,f(x))(x,f(x)), where xxx belongs to the domain of fff.
The vertical line test
Because a function gives only one output for each input, a vertical line can meet its graph at no more than one point.
A circle, for example, is not the graph of yyy as a function of xxx: some vertical lines meet it twice, giving two possible values of yyy for the same value of xxx.
Inputs and outputs
On a graph of y=f(x)y=f(x)y=f(x), the horizontal coordinate is the input xxx and the vertical coordinate is the output f(x)f(x)f(x).
Finding points on a graph
Let f(x)=x2−4x+3f(x)=x^2-4x+3f(x)=x2−4x+3. Find three points on its graph using inputs x=0x=0x=0, x=2x=2x=2 and x=5x=5x=5.
-
Substitute x=0x=0x=0:
f(0)=02−4(0)+3=3,f(0)=0^2-4(0)+3=3,f(0)=02−4(0)+3=3,so one point is (0,3)(0,3)(0,3).
-
Substitute x=2x=2x=2:
f(2)=22−4(2)+3=−1,f(2)=2^2-4(2)+3=-1,f(2)=22−4(2)+3=−1,so another point is (2,−1)(2,-1)(2,−1).
-
Substitute x=5x=5x=5:
f(5)=52−4(5)+3=8,f(5)=5^2-4(5)+3=8,f(5)=52−4(5)+3=8,so the third point is (5,8)(5,8)(5,8).
Confusing a function with its output
The symbol fff names the function, whereas f(3)f(3)f(3) is the particular output obtained when the input is 3.
Domain and range
The domain of a function is the set of permitted input values.
The range is the set of output values that the function actually produces.
For a graph of y=f(x)y=f(x)y=f(x):
- read the domain by looking at how far the graph extends horizontally;
- read the range by looking at how far the graph extends vertically.
An endpoint shown with a filled circle is included. An endpoint shown with an open circle is excluded.
Finding a domain and range
Consider the function
g(x)=5−2x.g(x)=\sqrt{5-2x}.g(x)=5−2x.Find its domain and range.
-
A square root is real only when its contents are non-negative, so require
5−2x≥0.5-2x\ge 0.5−2x≥0. -
Solving the inequality gives
−2x≥−5⇒x≤52.-2x\ge -5 \quad\Rightarrow\quad x\le \frac{5}{2}.−2x≥−5⇒x≤25.Therefore the domain is x≤52x\le \frac{5}{2}x≤25.
-
A square root cannot produce a negative output. The smallest output is zero, occurring when x=52x=\frac{5}{2}x=25, and the outputs increase without bound as xxx decreases. Therefore the range is g(x)≥0g(x)\ge 0g(x)≥0.
Restrictions on the domain
A denominator cannot equal zero, and the expression inside an even root must be non-negative when working with real-valued functions.
Reading important features
A graph gives more information than a collection of separate coordinates. You should be able to identify its overall shape and significant features.
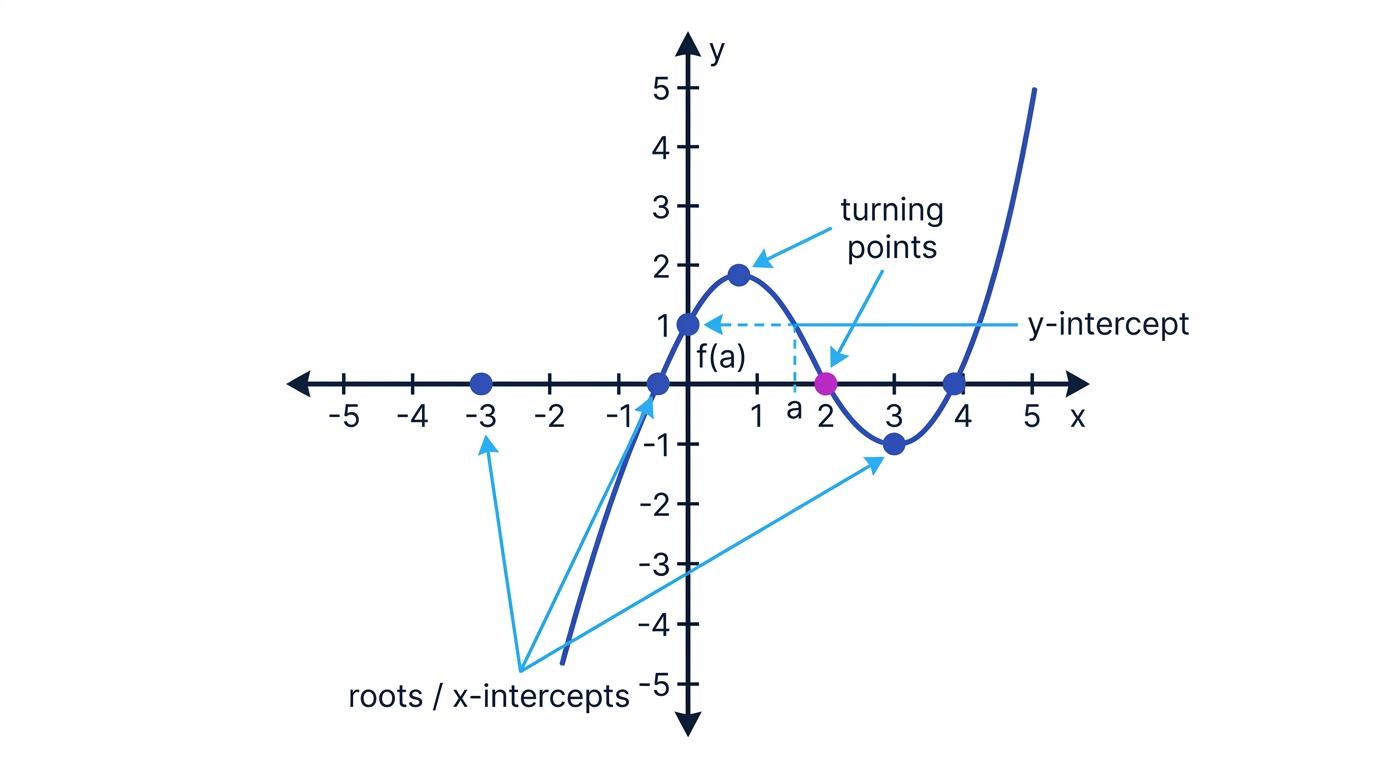
The diagram shows common features of a function graph, including intercepts, roots and turning points.
Intercepts and roots
An intercept is a point where a graph meets an axis.
- At a yyy-intercept, x=0x=0x=0, so its coordinates are (0,f(0))(0,f(0))(0,f(0)).
- At an xxx-intercept, y=0y=0y=0, so f(x)=0f(x)=0f(x)=0.
A value of xxx satisfying f(x)=0f(x)=0f(x)=0 is called a root or zero of the function.
Finding the intercepts
Find the intercepts of f(x)=x2−4x+3f(x)=x^2-4x+3f(x)=x2−4x+3.
-
For the yyy-intercept, set x=0x=0x=0:
f(0)=3.f(0)=3.f(0)=3.The yyy-intercept is (0,3)(0,3)(0,3).
-
For the xxx-intercepts, set f(x)=0f(x)=0f(x)=0:
x2−4x+3=0.x^2-4x+3=0.x2−4x+3=0. -
Factorise and solve:
(x−1)(x−3)=0,(x-1)(x-3)=0,(x−1)(x−3)=0,so x=1x=1x=1 or x=3x=3x=3. The xxx-intercepts are (1,0)(1,0)(1,0) and (3,0)(3,0)(3,0).
Turning points and increasing intervals
A turning point is a point where a graph changes direction:
- a local maximum is higher than nearby points;
- a local minimum is lower than nearby points.
A function is increasing over an interval if its outputs rise as xxx increases. It is decreasing if its outputs fall as xxx increases.
The word “local” matters: a local maximum need not be the greatest value over the function's entire domain.
End behaviour and asymptotes
The end behaviour describes what happens to f(x)f(x)f(x) as xxx becomes very large positive or negative.
An asymptote is a line that a graph approaches. For example, the graph of
f(x)=1xf(x)=\frac{1}{x}f(x)=x1approaches the vertical line x=0x=0x=0 and the horizontal line y=0y=0y=0, without meeting either one.
Reading a graph systematically
Scan from left to right, noting endpoints, intercepts, turning points, discontinuities, asymptotes and the graph's behaviour at each end.
Solving equations using graphs
Graphs are especially useful when an equation is difficult or impossible to solve neatly using algebra.
Solving f(x)=kf(x)=kf(x)=k
The solutions of f(x)=kf(x)=kf(x)=k are the xxx-coordinates where the graph y=f(x)y=f(x)y=f(x) meets the horizontal line y=ky=ky=k.
The number of intersections tells you the number of real solutions.
Solving f(x)=g(x)f(x)=g(x)f(x)=g(x)
The solutions of f(x)=g(x)f(x)=g(x)f(x)=g(x) are the xxx-coordinates where the graphs y=f(x)y=f(x)y=f(x) and y=g(x)y=g(x)y=g(x) intersect. At an intersection, both functions have the same input and output.
Finding intersections of two graphs
Find the intersections of y=x2y=x^2y=x2 and y=2x+3y=2x+3y=2x+3.
-
At an intersection, the two expressions for yyy are equal:
x2=2x+3.x^2=2x+3.x2=2x+3. -
Rearrange and factorise:
x2−2x−3=0⇒(x−3)(x+1)=0.x^2-2x-3=0 \quad\Rightarrow\quad (x-3)(x+1)=0.x2−2x−3=0⇒(x−3)(x+1)=0.Therefore x=3x=3x=3 or x=−1x=-1x=−1.
-
Substitute into either function. When x=3x=3x=3, y=9y=9y=9; when x=−1x=-1x=−1, y=1y=1y=1. The intersection points are (3,9)(3,9)(3,9) and (−1,1)(-1,1)(−1,1).
When reading solutions from a drawn graph, your answers will usually be approximate. State them to a precision justified by the scale, rather than giving unsupported extra decimal places.
Solving inequalities using graphs
To solve f(x)>0f(x)>0f(x)>0, identify where the graph lies above the xxx-axis. To solve f(x)<0f(x)<0f(x)<0, identify where it lies below the xxx-axis.
Similarly, f(x)>g(x)f(x)>g(x)f(x)>g(x) where the graph of y=f(x)y=f(x)y=f(x) lies above the graph of y=g(x)y=g(x)y=g(x).
Solving an inequality from a quadratic graph
Solve x2−4x+3≤0x^2-4x+3\le 0x2−4x+3≤0.
-
Find the boundary values by solving
x2−4x+3=0.x^2-4x+3=0.x2−4x+3=0.This gives x=1x=1x=1 and x=3x=3x=3.
-
The graph is an upward-opening quadratic, so it lies on or below the xxx-axis between its roots.
-
The inequality includes equality, so both roots are included:
1≤x≤3.1\le x\le 3.1≤x≤3.
Giving points instead of solutions
When solving an equation graphically, the required answers are usually the xxx-coordinates of the intersections, not the full coordinate pairs. Check exactly what the question asks for.
Graphs as models
A function can model how one quantity depends on another. In this context, you must interpret the graph using the meaning of its variables.
The mathematical domain may need restricting. For example, a formula modelling the height of a ball could produce values for every real time, but negative times and times after the ball hits the ground may not be relevant.
Interpreting a height model
A ball's height in metres after ttt seconds is modelled by
h(t)=20t−5t2,h(t)=20t-5t^2,h(t)=20t−5t2,for the time from release until it reaches the ground. Find the appropriate time domain.
-
The ball is released at t=0t=0t=0, so negative values of ttt are excluded.
-
Find when it reaches the ground by solving h(t)=0h(t)=0h(t)=0:
20t−5t2=0⇒5t(4−t)=0.20t-5t^2=0 \quad\Rightarrow\quad 5t(4-t)=0.20t−5t2=0⇒5t(4−t)=0.Hence t=0t=0t=0 or t=4t=4t=4.
-
The relevant part of the model runs from release to landing, so the appropriate domain is
0≤t≤4.0\le t\le 4.0≤t≤4.
Interpret in context
A mathematically valid part of a graph may be irrelevant to the situation being modelled. Always connect the domain, range and key points back to the quantities represented.
In the exam
- Label axes and use a sensible, even scale when drawing or interpreting a graph.
- For intersections, write the equation being represented, such as f(x)=g(x)f(x)=g(x)f(x)=g(x) or f(x)=0f(x)=0f(x)=0.
- Check whether endpoints are included, especially when solving inequalities or stating a domain.
- Give graphical estimates only to a precision supported by the graph.
- In modelling questions, include units and restrict your answer to values that make sense in context.
Check yourself
- How can you tell whether a curve represents yyy as a function of xxx?
- What graph features give the solutions of f(x)=0f(x)=0f(x)=0 and f(x)=g(x)f(x)=g(x)f(x)=g(x)?
- Why might the domain of a mathematical model be smaller than the natural domain of its formula?
