Question 3
The partially completed histogram shows completion times, recorded to the nearest second.
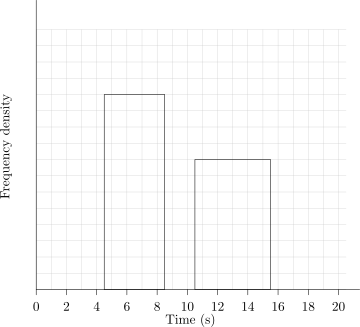
Time (s)1–45–89–1011–1516–20Frequency2128?3\begin{array}{c|ccccc}\text{Time (s)}&1\text{–}4&5\text{–}8&9\text{–}10&11\text{–}15&16\text{–}20\\\hline\text{Frequency}&2&12&8&?&3\end{array}Time (s)Frequency1–425–8129–10811–15?16–203
a.[1]
Use the relative bar areas to find the missing frequency.
b.[2]
Calculate the frequency densities for the three classes not drawn.
c.[2]
Estimate the probability that a randomly selected participant took under 10 seconds.
2.2.2 Area in a histogram is proportional to frequency Questions
8 exam-style questions on OCR (MEI) A Level Maths 2.2.2 Area in a histogram is proportional to frequency. Each one has a worked solution and a mark scheme showing where the marks go.