

What you'll learn
- How to interpret displacement–time, velocity–time and acceleration–time graphs.
- How gradients connect displacement, velocity and acceleration.
- How areas under graphs give displacement or change in velocity.
- How to distinguish displacement from distance, especially when motion changes direction.
Describing straight-line motion
In kinematics, we study the motion of a particle. A particle is a model in which an object's size and shape are ignored, so its position can be represented by a single point.
For motion along a straight line, choose one direction as positive. Motion in the opposite direction is then negative.
The basic quantities
- Displacement, sss, is the directed distance of the particle from a fixed origin. It is measured in metres.
- Velocity, vvv, is the rate of change of displacement. It is measured in m s⁻¹.
- Speed is the magnitude of velocity, so it is always non-negative.
- Acceleration, aaa, is the rate of change of velocity. It is measured in m s⁻².
A negative displacement means that the particle is on the negative side of the origin. A negative velocity means that it is moving in the negative direction. Neither necessarily means that the particle is slowing down.
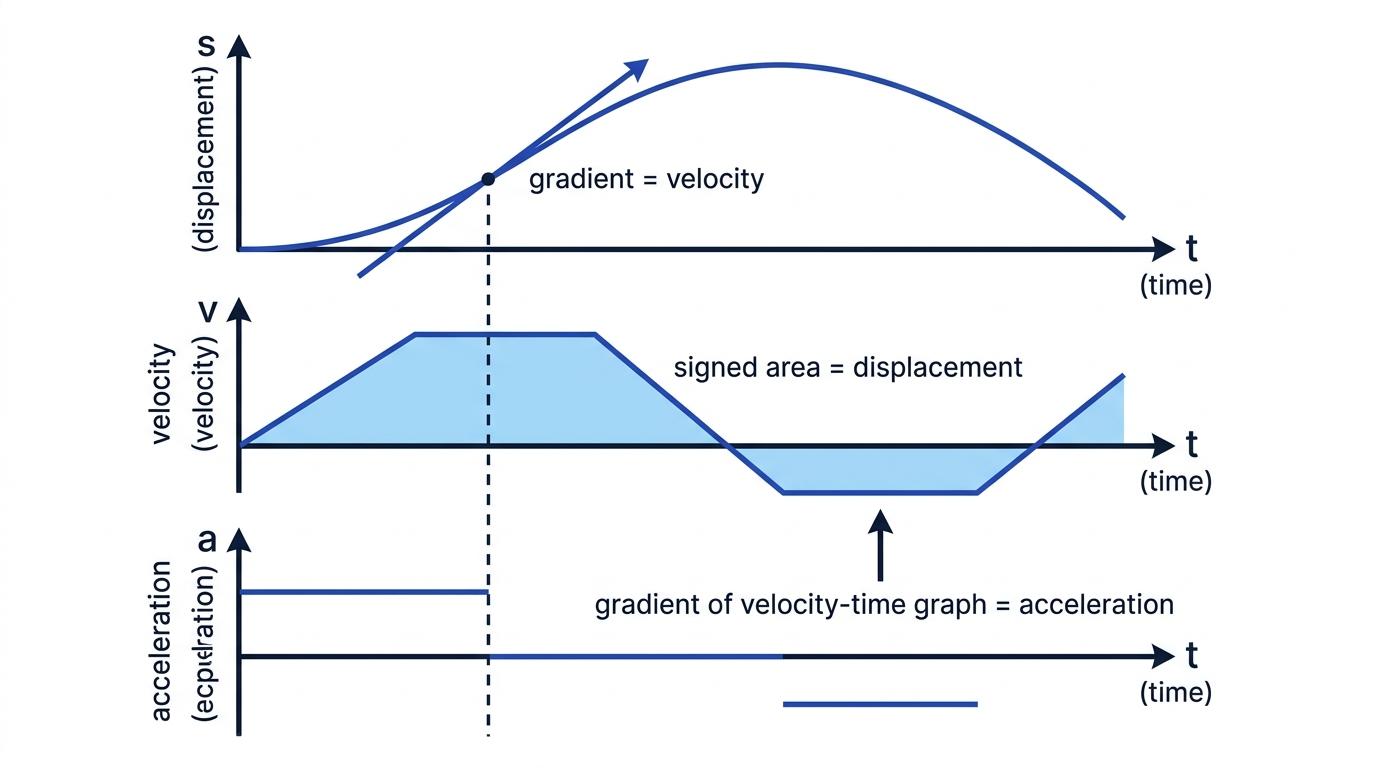
Displacement–time graphs
A displacement–time graph shows displacement sss on the vertical axis and time ttt on the horizontal axis.
Gradient gives velocity
The gradient of a displacement–time graph represents velocity:
v=change in displacementchange in timev=\frac{\text{change in displacement}}{\text{change in time}}v=change in timechange in displacementFor a straight section, the velocity is constant and can be found using the gradient of the line.
For a curved graph, the velocity is changing. The velocity at one particular instant is the gradient of the tangent to the curve at that point. A tangent is a straight line that follows the direction of the curve at the chosen point.
Reading a displacement–time graph
- A positive gradient means positive velocity.
- A negative gradient means negative velocity.
- A zero gradient means the particle is instantaneously at rest.
- A steeper graph means a greater speed because the magnitude of the gradient is larger.
Finding velocity from a displacement–time graph
A particle's displacement increases linearly from 3 m at 2 s to 23 m at 7 s.
-
Use the gradient because the graph gives displacement against time:
v=ΔsΔtv=\frac{\Delta s}{\Delta t}v=ΔtΔs -
The changes are Δs=23−3=20\Delta s=23-3=20Δs=23−3=20 m and Δt=7−2=5\Delta t=7-2=5Δt=7−2=5 s.
-
Therefore,
v=205=4 m s−1v=\frac{20}{5}=4\text{ m s}^{-1}v=520=4 m s−1The positive answer shows that the particle is moving in the chosen positive direction.
Curvature gives information about acceleration
If the gradient of a displacement–time graph is becoming more positive, the velocity is increasing, so acceleration is positive.
If the gradient is becoming less positive or more negative, velocity is decreasing, so acceleration is negative.
Confusing height with velocity
The vertical coordinate on a displacement–time graph gives displacement, not velocity. Velocity comes from the gradient of the graph.
Velocity–time graphs
A velocity–time graph shows velocity vvv against time $t`. It gives two important pieces of information: its gradient gives acceleration, while its signed area gives displacement.
Gradient gives acceleration
For a straight section of a velocity–time graph,
a=change in velocitychange in timea=\frac{\text{change in velocity}}{\text{change in time}}a=change in timechange in velocityA horizontal line has gradient zero, so it represents constant velocity and zero acceleration.
A downward-sloping line has negative acceleration. This does not automatically mean that the particle is slowing down: you must also consider the sign of its velocity.
When does speed increase?
A particle speeds up when velocity and acceleration have the same sign. It slows down when they have opposite signs.
For example, if both vvv and aaa are negative, the velocity is becoming more negative. Its magnitude is increasing, so the particle is speeding up in the negative direction.
Finding acceleration from a velocity–time graph
The velocity of a particle decreases uniformly from 14 m s⁻¹ at 3 s to 2 m s⁻¹ at 7 s.
-
Since acceleration is the gradient of a velocity–time graph, calculate
a=2−147−3.a=\frac{2-14}{7-3}.a=7−32−14. -
This gives
a=−124=−3 m s−2.a=\frac{-12}{4}=-3\text{ m s}^{-2}.a=4−12=−3 m s−2. -
The velocity is positive while acceleration is negative, so the particle is slowing down during this interval.
Area gives displacement
The signed area between a velocity–time graph and the time axis gives the change in displacement:
Δs=signed area under the velocity–time graph\Delta s=\text{signed area under the velocity--time graph}Δs=signed area under the velocity–time graphAn area above the time axis is positive. An area below the time axis is negative.
Finding displacement and distance
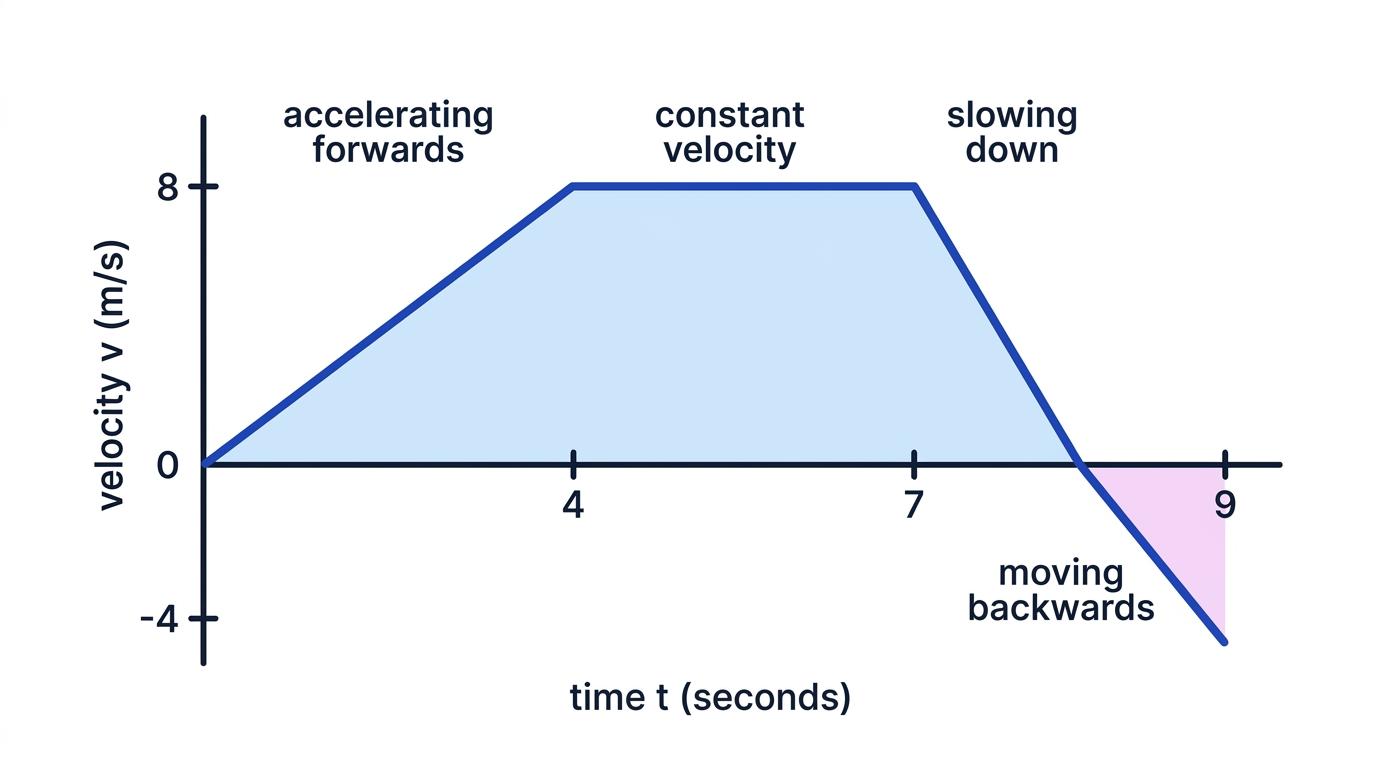
A particle accelerates uniformly from rest to 8 m s⁻¹ during the first 4 s. It then travels at 8 m s⁻¹ for 3 s before its velocity decreases uniformly to −4 m s⁻¹ over the next 2 s.
-
From 0 to 4 s, the area is a triangle:
12×4×8=16 m.\frac{1}{2}\times 4\times 8=16\text{ m}.21×4×8=16 m. -
From 4 to 7 s, the area is a rectangle:
3×8=24 m.3\times 8=24\text{ m}.3×8=24 m. -
From 7 to 9 s, the velocity falls from 8 to −4 m s⁻¹. It reaches zero after 812×2=43\frac{8}{12}\times 2=\frac{4}{3}128×2=34 s, so the positive triangle has base 43\frac{4}{3}34 s:
12×43×8=163 m.\frac{1}{2}\times\frac{4}{3}\times 8=\frac{16}{3}\text{ m}.21×34×8=316 m.The negative triangle has base 23\frac{2}{3}32 s:
−12×23×4=−43 m.-\frac{1}{2}\times\frac{2}{3}\times 4=-\frac{4}{3}\text{ m}.−21×32×4=−34 m. -
The total displacement is the sum of the signed areas:
16+24+163−43=44 m.16+24+\frac{16}{3}-\frac{4}{3}=44\text{ m}.16+24+316−34=44 m. -
Distance uses the magnitudes of all the areas:
16+24+163+43=1403 m.16+24+\frac{16}{3}+\frac{4}{3}=\frac{140}{3}\text{ m}.16+24+316+34=3140 m.
Using signed area for distance
Signed area gives displacement. To find total distance, split the graph wherever it crosses the time axis and add the magnitudes of the separate areas.
Changing direction
A particle changes direction when its velocity changes sign. On a velocity–time graph, this occurs when the graph crosses the time axis.
Merely touching the axis does not always mean a change of direction. Check whether the velocity has different signs on the two sides of the point.
On a displacement–time graph, a change of direction usually appears as a turning point because the gradient changes sign.
Acceleration–time graphs
An acceleration–time graph shows acceleration aaa against time $t`.
The signed area under an acceleration–time graph gives the change in velocity:
Δv=signed area under the acceleration–time graph\Delta v=\text{signed area under the acceleration--time graph}Δv=signed area under the acceleration–time graphTherefore, if the initial velocity is uuu,
v=u+signed area.v=u+\text{signed area}.v=u+signed area.Using an acceleration–time graph
A particle has initial velocity 5 m s⁻¹. Its acceleration is 3 m s⁻² for 4 s, followed by −2 m s⁻² for 5 s.
-
During the first interval, the change in velocity is
Δv1=3×4=12 m s−1.\Delta v_1=3\times 4=12\text{ m s}^{-1}.Δv1=3×4=12 m s−1. -
During the second interval, the signed area gives
Δv2=−2×5=−10 m s−1.\Delta v_2=-2\times 5=-10\text{ m s}^{-1}.Δv2=−2×5=−10 m s−1. -
Add both changes to the initial velocity:
v=5+12−10=7 m s−1.v=5+12-10=7\text{ m s}^{-1}.v=5+12−10=7 m s−1.
Check area units
The units help you remember the meaning of an area. On a velocity–time graph, m s⁻¹ multiplied by s gives m. On an acceleration–time graph, m s⁻² multiplied by s gives m s⁻¹.
Connecting the three graphs
The graphs describe the same motion from different viewpoints:
displacement→gradientvelocity→gradientacceleration\text{displacement}\xrightarrow{\text{gradient}}\text{velocity} \xrightarrow{\text{gradient}}\text{acceleration}displacementgradientvelocitygradientaccelerationMoving in the opposite direction uses areas:
acceleration→areachange in velocity,velocity→areachange in displacement.\text{acceleration}\xrightarrow{\text{area}}\text{change in velocity}, \qquad \text{velocity}\xrightarrow{\text{area}}\text{change in displacement}.accelerationareachange in velocity,velocityareachange in displacement.When sketching one graph from another, focus on signs, zeros, gradients and turning points rather than trying to reproduce an exact shape without enough information.
In the exam
- Check both axis labels before deciding whether to use a gradient or an area.
- Mark where a velocity graph crosses the time axis before calculating distance or identifying changes of direction.
- Keep signs during displacement and velocity calculations, and include the correct SI units in your final answer.
- Use a tangent for an instantaneous gradient on a curve, choosing points far apart on the tangent to improve accuracy.
Check yourself
- What does a horizontal section represent on each of the three types of graph?
- How can a particle have negative acceleration while its speed is increasing?
- How would you calculate total distance from a velocity–time graph that crosses the time axis twice?
