

What you'll learn
- What positive, negative and no correlation look like.
- How correlation differs from causation.
- Why a correlation may arise without a direct causal link.
- How to assess claims about cause and effect critically.
Variables and scatter diagrams
A variable is a quantity or characteristic that can take different values. For example, a study might record each person’s weekly exercise time and resting heart rate.
When paired values of two variables are collected, they can be plotted on a scatter diagram. Each point represents one individual item or observation.
Correlation
Correlation is an association between two variables: as one variable changes, the other tends to change in a particular direction.
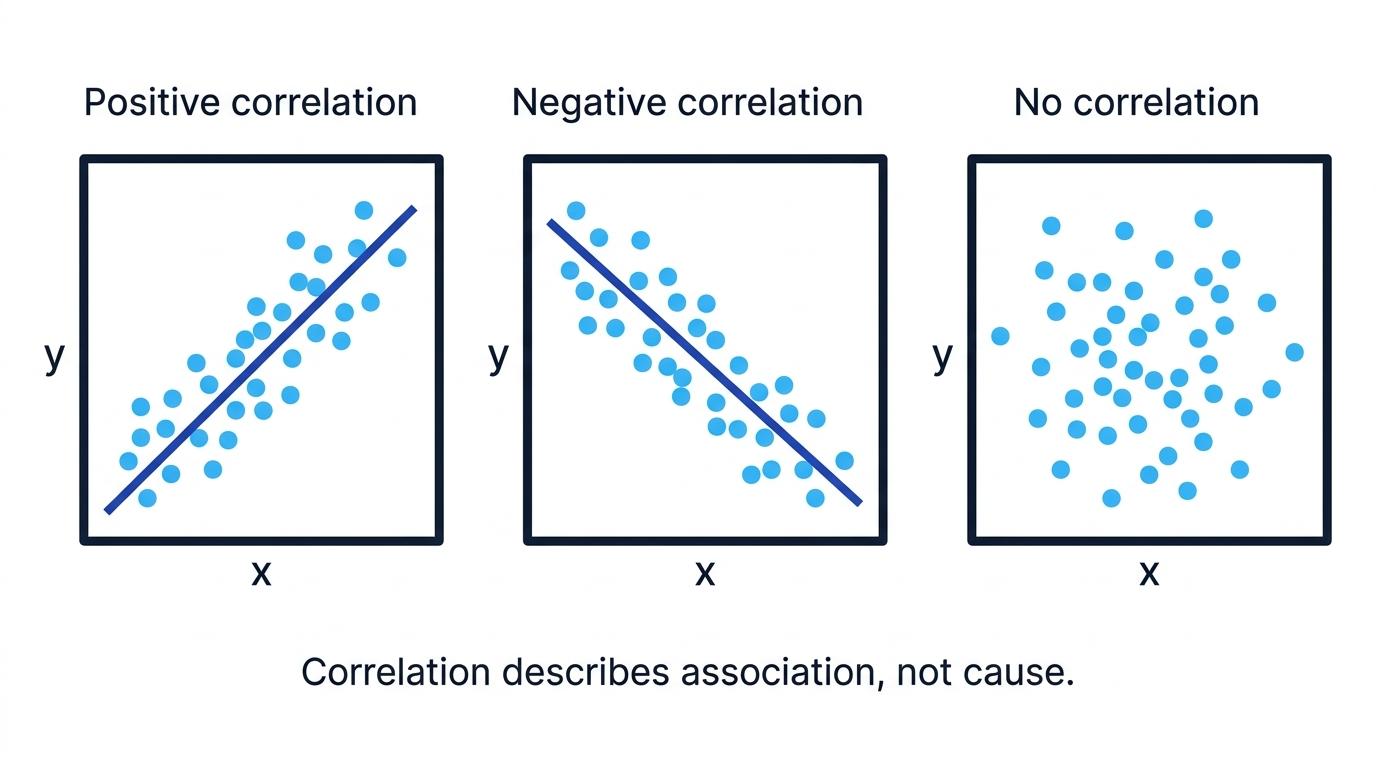
Positive correlation
There is positive correlation when larger values of one variable tend to be associated with larger values of the other. The points on a scatter diagram generally rise from left to right.
For example, height and arm span usually have positive correlation.
Negative correlation
There is negative correlation when larger values of one variable tend to be associated with smaller values of the other. The points generally fall from left to right.
For example, among similar cars travelling the same route, fuel efficiency and fuel used may have negative correlation.
No correlation
There is no correlation when there is no apparent association between the variables. Knowing the value of one variable does not help you predict whether the other will be high or low.
What correlation tells you
Correlation describes the direction and strength of an association. On its own, it does not explain why that association exists.
Interpreting an association
A scatter diagram shows the number of hours students spent revising and their test scores. The points lie fairly close to an upward-sloping trend.
- As revision time increases, test score also tends to increase, so the direction is positive.
- Because the points are fairly close to a clear trend, the relationship appears reasonably strong.
- The correct conclusion is that revision time and test score are positively correlated. The diagram alone does not prove that extra revision caused the higher scores.
Describing every point
Correlation is an overall tendency. Positive correlation does not mean that every larger value of one variable must be paired with a larger value of the other.
What is causation?
Causation
Causation means that a change in one variable directly produces a change in another variable.
For example, increasing the amount of water in a fixed volume of squash directly makes the drink more dilute. There is a mechanism linking the change in one variable to the change in the other.
A causal relationship often creates correlation, but the reverse is not automatically true.
The central principle
Correlation does not imply causation. If two variables are correlated, you cannot conclude from the correlation alone that one causes the other.
This distinction matters because scatter diagrams and correlation calculations only detect association. They do not identify the process producing it.
Why correlation may not mean causation
A third variable
A third variable, sometimes called a confounding variable, may affect both variables being studied. This can create a correlation even when neither recorded variable directly causes the other.
Finding a confounding variable
Data collected across several months show positive correlation between ice-cream sales and the number of people treated for sunburn.
- A claim that buying ice cream causes sunburn is not supported by any sensible direct mechanism.
- Temperature and sunny weather provide a plausible third variable: hot, sunny days increase both ice-cream sales and exposure to strong sunlight.
- The data therefore show an association, but the correlation can be explained without ice-cream sales causing sunburn.
Search for a shared influence
When two variables are correlated, ask: “Could another variable reasonably affect both of them?” Age, weather, income, population size and time are common confounding variables.
Reverse causation
Even if there is a causal link, its direction may be the reverse of the direction first suggested.
Suppose a survey finds that people who take more painkillers report more pain. It would be misleading to argue immediately that painkillers cause the pain. Greater pain may instead cause people to take more painkillers.
Reverse causation
Reverse causation occurs when the second variable causes changes in the first, rather than the first causing changes in the second.
Questioning the direction of causation
A study finds that towns with more police officers tend to record more crime.
- The correlation is positive, but this does not establish that employing more police officers causes more crime.
- Reverse causation is plausible: towns with higher crime levels may need to employ more police officers.
- Other variables, such as population size, could also increase both the number of crimes and the number of officers.
- The data alone therefore do not justify a causal conclusion in either direction.
Coincidence and misleading patterns
A correlation can sometimes occur by chance, especially when:
- the sample is small;
- many different pairs of variables are tested;
- the observations cover only a short or unusual period.
A pattern found in one sample may not represent a genuine relationship in the wider population.
Spurious correlation
A spurious correlation is an apparent association that does not represent a meaningful direct relationship. It may result from chance, a confounding variable or the way the data were selected.
Observational studies and experiments
An observational study records variables without deliberately changing the conditions. Such studies can reveal correlation, but confounding variables often make causal claims difficult to justify.
A controlled experiment deliberately changes an explanatory variable and measures its effect on a response variable, while trying to keep other relevant factors controlled. Random allocation to treatment groups can help make the groups comparable.
Controlled experiments generally provide stronger evidence of causation than observational studies. However, even an experiment must be well designed: a biased sample, poor controls or inaccurate measurements can weaken its conclusions.
Assessing evidence for a causal claim
Researchers observe that students who eat breakfast tend to achieve higher examination scores.
- This is an observational result because the researchers have recorded existing behaviour rather than assigned students to eat or skip breakfast.
- Possible confounding variables include household income, sleep routine, attendance and general health; any of these could be related to both breakfast habits and attainment.
- The evidence supports the statement that breakfast and examination score are associated.
- It does not, by itself, support the stronger conclusion that eating breakfast causes higher examination scores.
Evaluating a claim
When a question presents a correlation and asks whether one variable causes another, consider:
- Association: Is there actually a clear relationship in the data?
- Mechanism: Is there a credible explanation for how one variable could affect the other?
- Direction: Could the second variable cause the first?
- Confounding: Could another variable affect both?
- Study design: Was this an observational study or a controlled experiment?
- Representativeness: Is the sample large and suitable for the population being discussed?
Using absolute language
Do not write “there is no causation” merely because only correlation has been shown. The correct conclusion is that the data provide insufficient evidence to establish causation. A causal relationship might exist, but it has not been proved by the correlation alone.
In the exam
- State the observed association precisely, including whether the correlation is positive or negative.
- Say explicitly that correlation alone does not imply causation.
- Give a plausible confounding variable or explain possible reverse causation in the context of the question.
- Match the strength of your conclusion to the evidence: use wording such as “suggests an association” rather than “proves that”.
- If relevant, explain that a well-designed controlled experiment would provide stronger evidence of causation.
Check yourself
- Why does positive correlation between two variables not prove that increasing one will increase the other?
- What third variable might explain a correlation between the number of cold drinks sold and the number of people visiting an outdoor swimming pool?
- Why is a controlled experiment usually stronger evidence for causation than an observational study?
