Question 18
The partially completed histogram and the partially completed table show the times taken, to the nearest second, for a group of people to complete a puzzle.
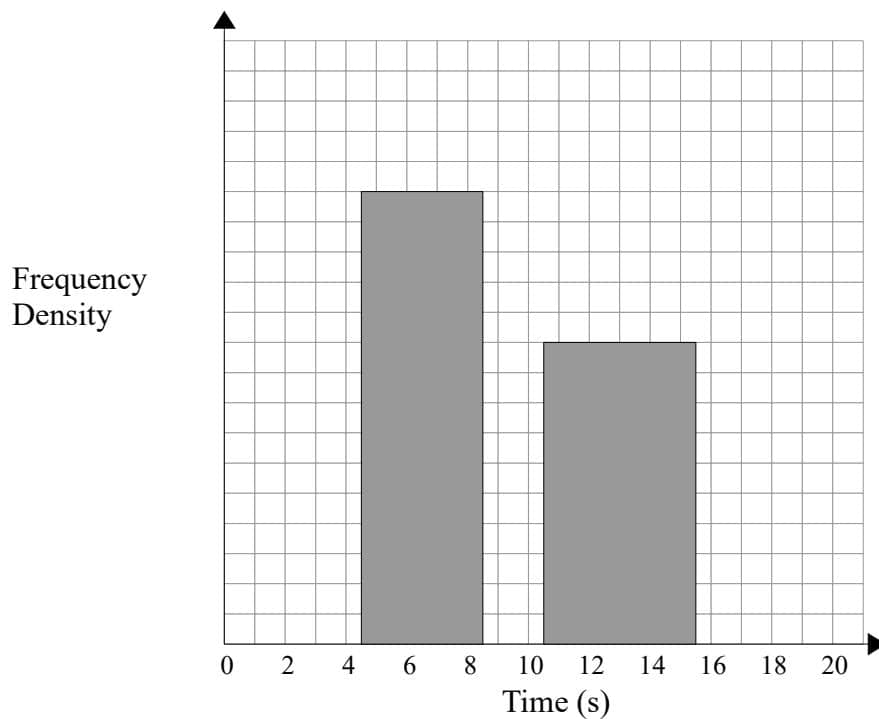
| Time (seconds) | Frequency |
|---|---|
| 1–4 | 2 |
| 5–8 | 12 |
| 9–10 | 8 |
| 11–15 | |
| 16–20 | 3 |
a.[1]
Complete the table.
b.[2]
Complete the histogram.
c.[2]
One of the participants is selected at random.
Estimate the probability that this participant completed the puzzle in under 10 seconds.
Give your answer as an exact fraction.
3.4 Histograms Questions
36 exam-style questions on Edexcel A Level Maths 3.4 Histograms. Each one has a worked solution and a mark scheme showing where the marks go.