Straight Line Graphs
123456789101112131415161718192021222324252627282930313233343536373839404142434445464748495051525354555657585960616263646566676869707172737475767778798081828384858687888990919293949596979899100101102103104105106107108109110111112113114115116117118119120121122123124125126127128129130131132133134135136137138139140141142143144145146147148
Question 10
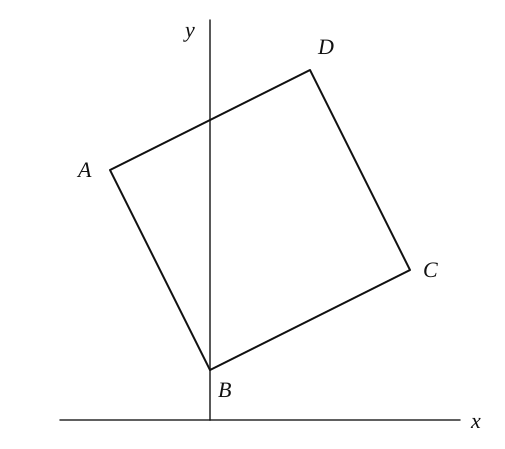
Points A(−2,5)A(-2, 5)A(−2,5), B(0,1)B(0, 1)B(0,1), C(4,3)C(4, 3)C(4,3) and D(2,7)D(2, 7)D(2,7) are the vertices of a quadrilateral ABCDABCDABCD.
a.[4]
Prove that ABCD ABCD\,ABCD is a rectangle.
b.[2]
Find the area of ABCDABCDABCD.
Straight Line Graphs Questions
260 exam-style questions on Edexcel A Level Maths Straight Line Graphs, covering 5.1 y = mx + c, 5.2 Equations of Straight Lines, 5.3 Parallel and Perpendicular Lines, 5.4 Length and Area, and 5.5 Modelling with Straight Lines. Each one has a worked solution and a mark scheme showing where the marks go.