Question 3
An automated planetary rover analyzes 400 specific geological sites on Mars. Each site is tested for the presence of specific signatures using three sensors:
- Spectrometer (SSS)
- Magnetometer (MMM)
- Thermal Imager (TTT)
The detection data for these 400 sites is summarized below:
| Sensor Detection | SSS | MMM | TTT | S S\,S and MMM | S S\,S and TTT | M M\,M and TTT | All three |
|---|---|---|---|---|---|---|---|
| Number of Sites | 220 | 160 | 140 | 85 | 75 | 60 | 35 |
a.[3]
Represent this information by fully completing a Venn diagram. [A Venn diagram with three intersecting circles labeled SSS, MMM, and T T\,T is provided. The region for S S\,S only (sites detected by S S\,S but not M M\,M or TTT) is marked with the value 95.]
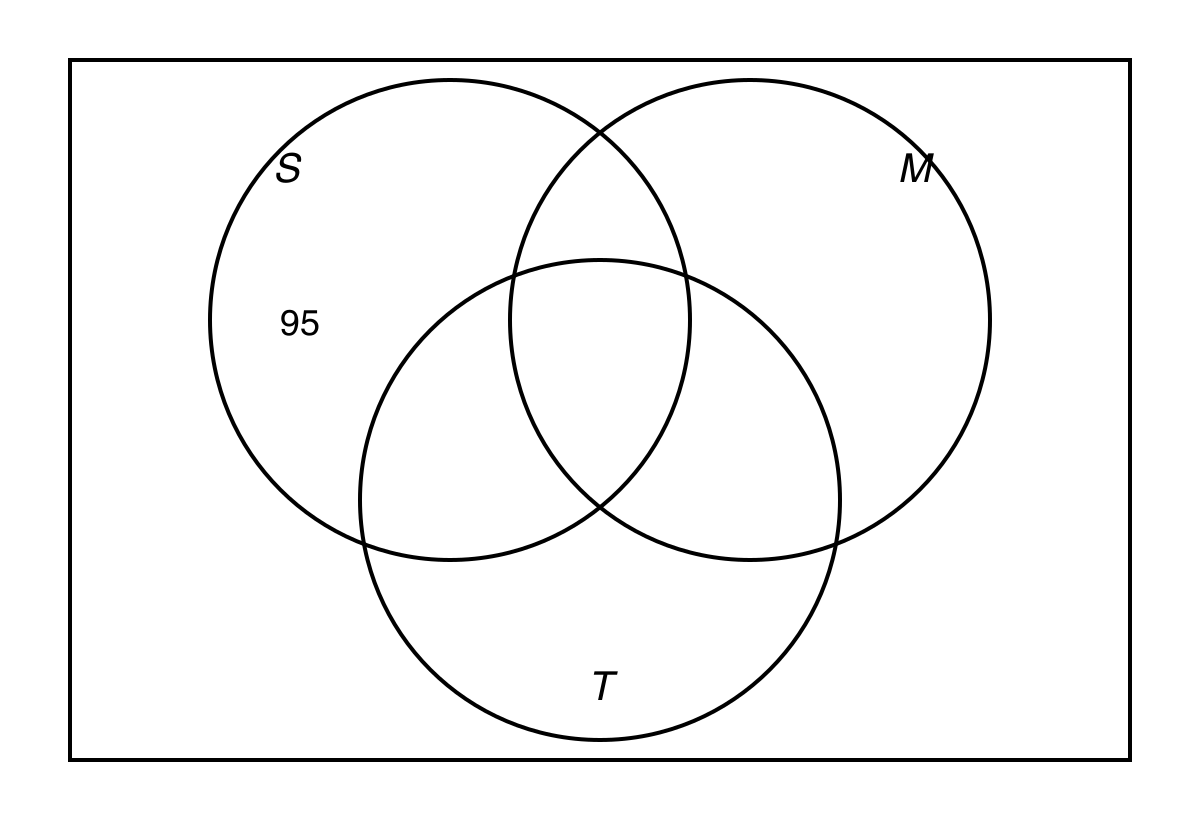
b.[4]
A geological site is selected at random from the 400 sites. Calculate the probability that the site:
(i) triggered detection in the Spectrometer only.
(ii) triggered detection in at least two of the sensors.
(iii) triggered detection in the Spectrometer or the Magnetometer (or both), given that it did not trigger the Thermal Imager.
c.[3]
Determine whether the detection of a signature by the Magnetometer and the detection by the Thermal Imager are statistically independent. Justify your answer with numerical evidence.
2.3 Conditional Probabilities in Venn Diagrams Questions
31 exam-style questions on Edexcel A Level Maths 2.3 Conditional Probabilities in Venn Diagrams. Each one has a worked solution and a mark scheme showing where the marks go.