Revision notes for Edexcel A Level Maths Regression, Correlation and Hypothesis Testing. Open each subtopic for explanations, worked examples, and summaries of Exponential Models, Measuring Correlation, and Hypothesis Testing for Zero Correlation. Written against the Edexcel A Level Maths (9MA0) specification, so the content matches what's examinable rather than general Maths background.
Regression, Correlation and Hypothesis Testing
What you'll learn
- How to describe scatter diagrams and interpret correlation.
- How to use regression lines sensibly, including gradients and variables.
- How to test for correlation using the product moment correlation coefficient.
- How logarithms turn some curved models into straight-line models.
The big picture: paired data
Definition
Bivariate data
Bivariate data means paired values collected from the same item, person, day or situation. For example, temperature and daily sales for the same day form one pair of data.
Usually we call the variable on the horizontal axis xxx and the variable on the vertical axis yyy.
The explanatory variable is the variable you use to help predict another variable. The response variable is the variable being predicted.
For example, if you are investigating whether warmer weather affects sales, temperature would normally be the explanatory variable, and sales would be the response variable.
Scatter diagrams and correlation
A scatter diagram plots each data pair as a point. It helps you judge whether a relationship looks:
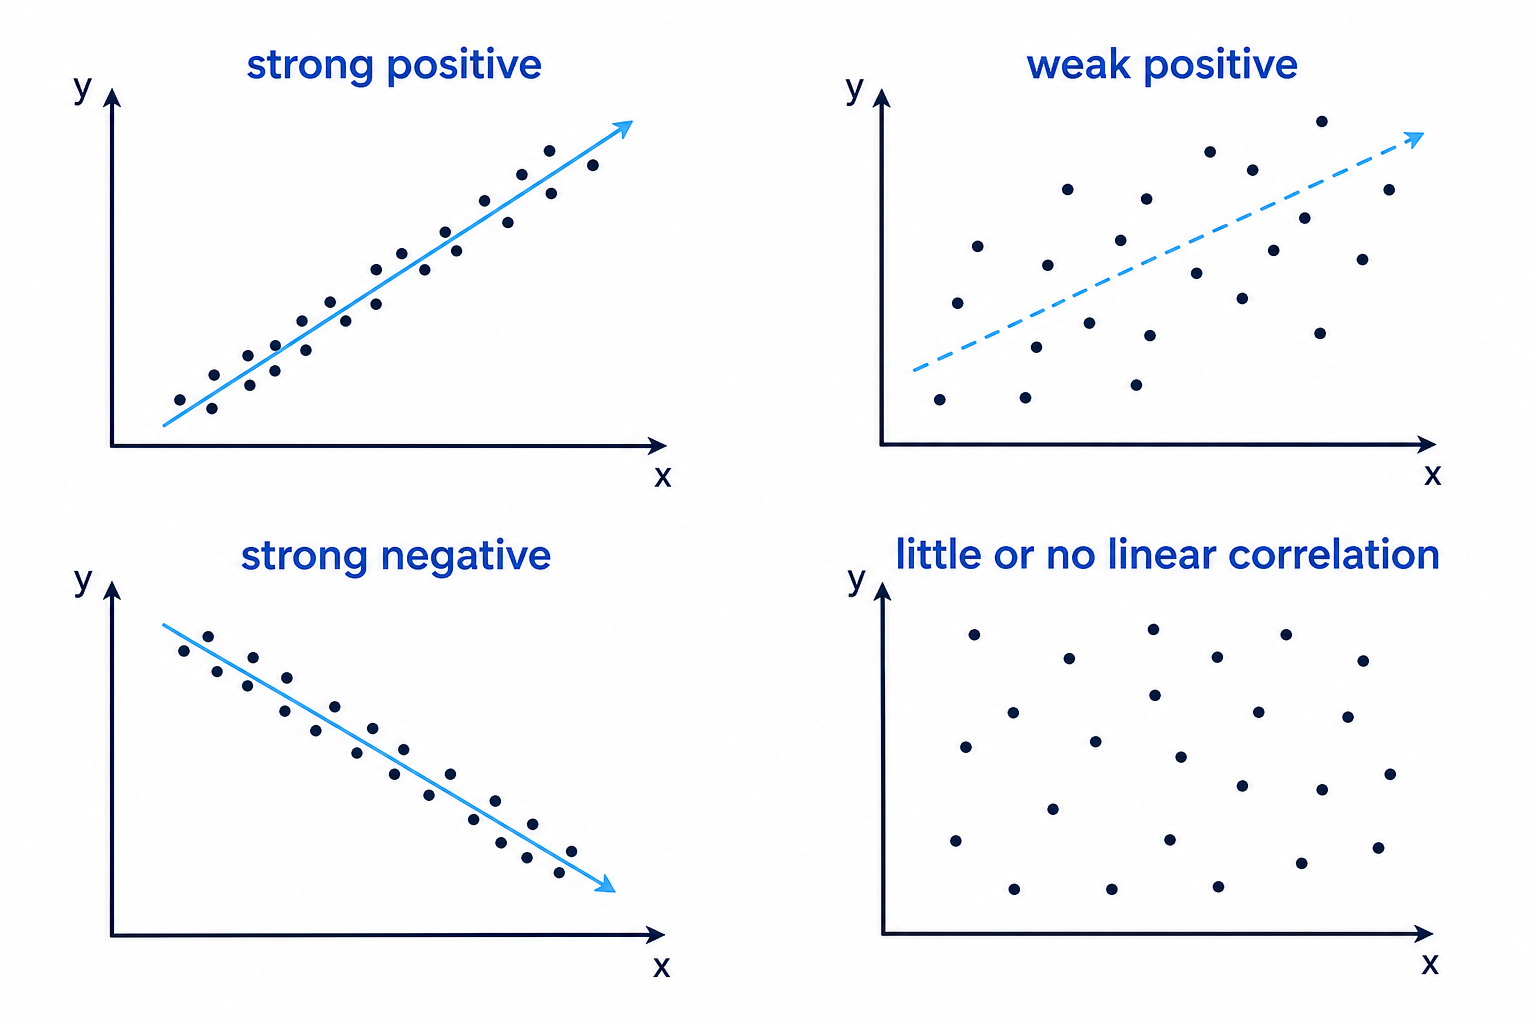
- positive: as one variable increases, the other tends to increase;
- negative: as one variable increases, the other tends to decrease;
- strong: points lie close to a clear pattern;
- weak: points are more spread out.
Definition
Correlation
Correlation describes the strength and direction of a relationship between two variables. In A-Level Statistics, we usually focus on linear correlation, meaning how closely the points follow a straight-line pattern.
Example
Describing a scatter diagram
A coach records the heights and weights of 12 athletes. A scatter diagram shows that taller athletes tend to be heavier, and the points are fairly close to an upward-sloping line.
-
Put height on the horizontal axis if height is being used to help explain weight.
-
Put weight on the vertical axis because it is the response variable.
-
Since the points rise from left to right, describe the relationship as positive correlation.
-
Since the points are fairly close to a straight-line pattern, say there is fairly strong positive linear correlation.
Common Mistake
Correlation is not causation
A correlation tells you that two variables tend to move together. It does not, by itself, prove that one variable causes the other.
The product moment correlation coefficient
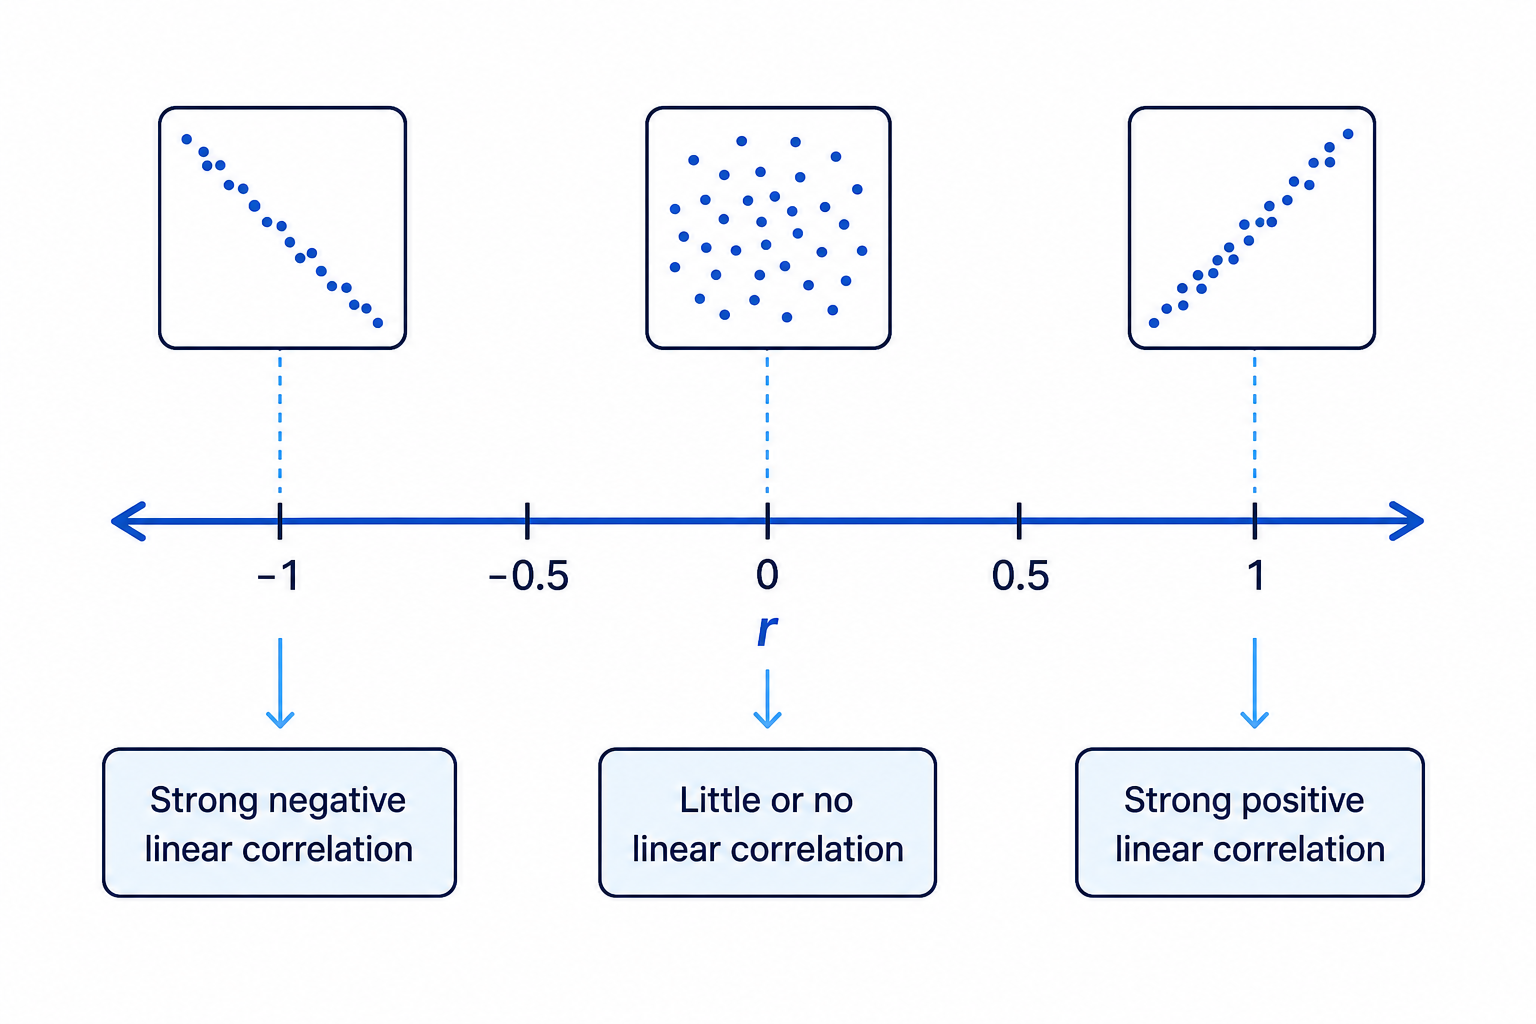
The product moment correlation coefficient, usually called PMCC, gives a numerical measure of linear correlation.
Definition
PMCC
The PMCC, written rrr, is a number between -1 and 1 calculated from sample data. Values close to 1 show strong positive linear correlation, values close to -1 show strong negative linear correlation, and values close to 0 show little or no linear correlation.
The population correlation coefficient is written ρ\rhoρ. This is important in hypothesis testing: rrr comes from your sample, while ρ\rhoρ describes the whole population.
Key Idea
Reading
The sign of rrr gives the direction. The size of ∣r∣|r|∣r∣ gives the strength. A value near 0 only means “no clear straight-line relationship”; there could still be a curved relationship.
Example
Interpreting a PMCC
An analyst records years of experience and time taken to complete a task for 12 employees. The PMCC is r=−0.47r=-0.47r=−0.47.
-
The value is negative, so the relationship is negative.
-
This suggests that employees with more experience tend to take less time.
-
Since ∣r∣=0.47|r|=0.47∣r∣=0.47, the relationship is not very strong.
-
A sensible interpretation is: there is weak to moderate negative linear correlation between experience and task time.
Tip
Quick PMCC checks
The PMCC has no units, and swapping the two variables does not change its value. A very high or very low value only measures how linear the relationship is.
Regression lines
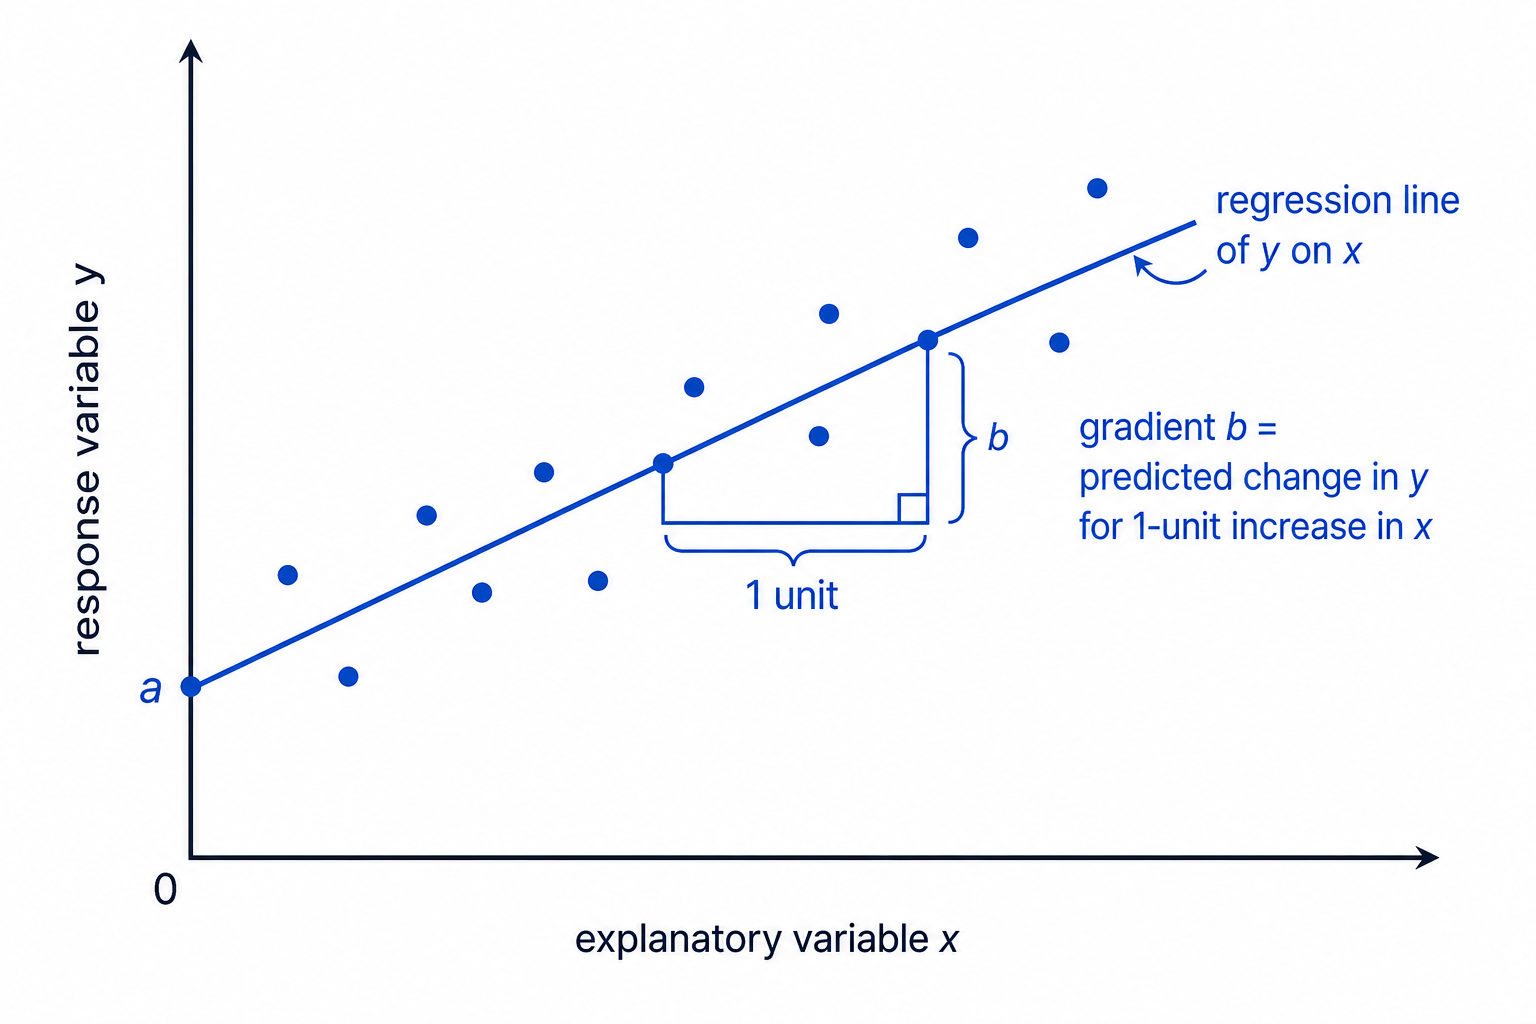
A regression line is a straight-line model used to predict one variable from another.
Definition
Regression line of on
The regression line of yyy on xxx is the straight line used to predict yyy from xxx. It is usually written in the form y=a+bxy=a+bxy=a+bx, where bbb is the gradient and aaa is the intercept.
The gradient tells you the predicted change in the response variable for each one-unit increase in the explanatory variable.
The intercept is the predicted value of the response variable when the explanatory variable is 0. This is only meaningful if 0 makes sense in the context.
Example
Interpreting a regression equation
A café owner records daily temperature, ttt °C, and daily sales, £SSS, for 10 summer days. A regression model is
S=4800+135tS=4800+135tS=4800+135tand the PMCC is r=0.69r=0.69r=0.69.
-
Temperature is the explanatory variable because it is being used to predict sales.
-
Sales is the response variable because it is being predicted.
-
The gradient is 135, so the model predicts that sales increase by about £135 for each extra 1°C.
-
Since r=0.69r=0.69r=0.69, the positive linear correlation is moderately strong, so a linear model is reasonably consistent with the data.
-
The intercept 4800 means the model predicts sales of £4800 when the temperature is 0°C, but this may not be useful if the data were only collected in summer.
Common Mistake
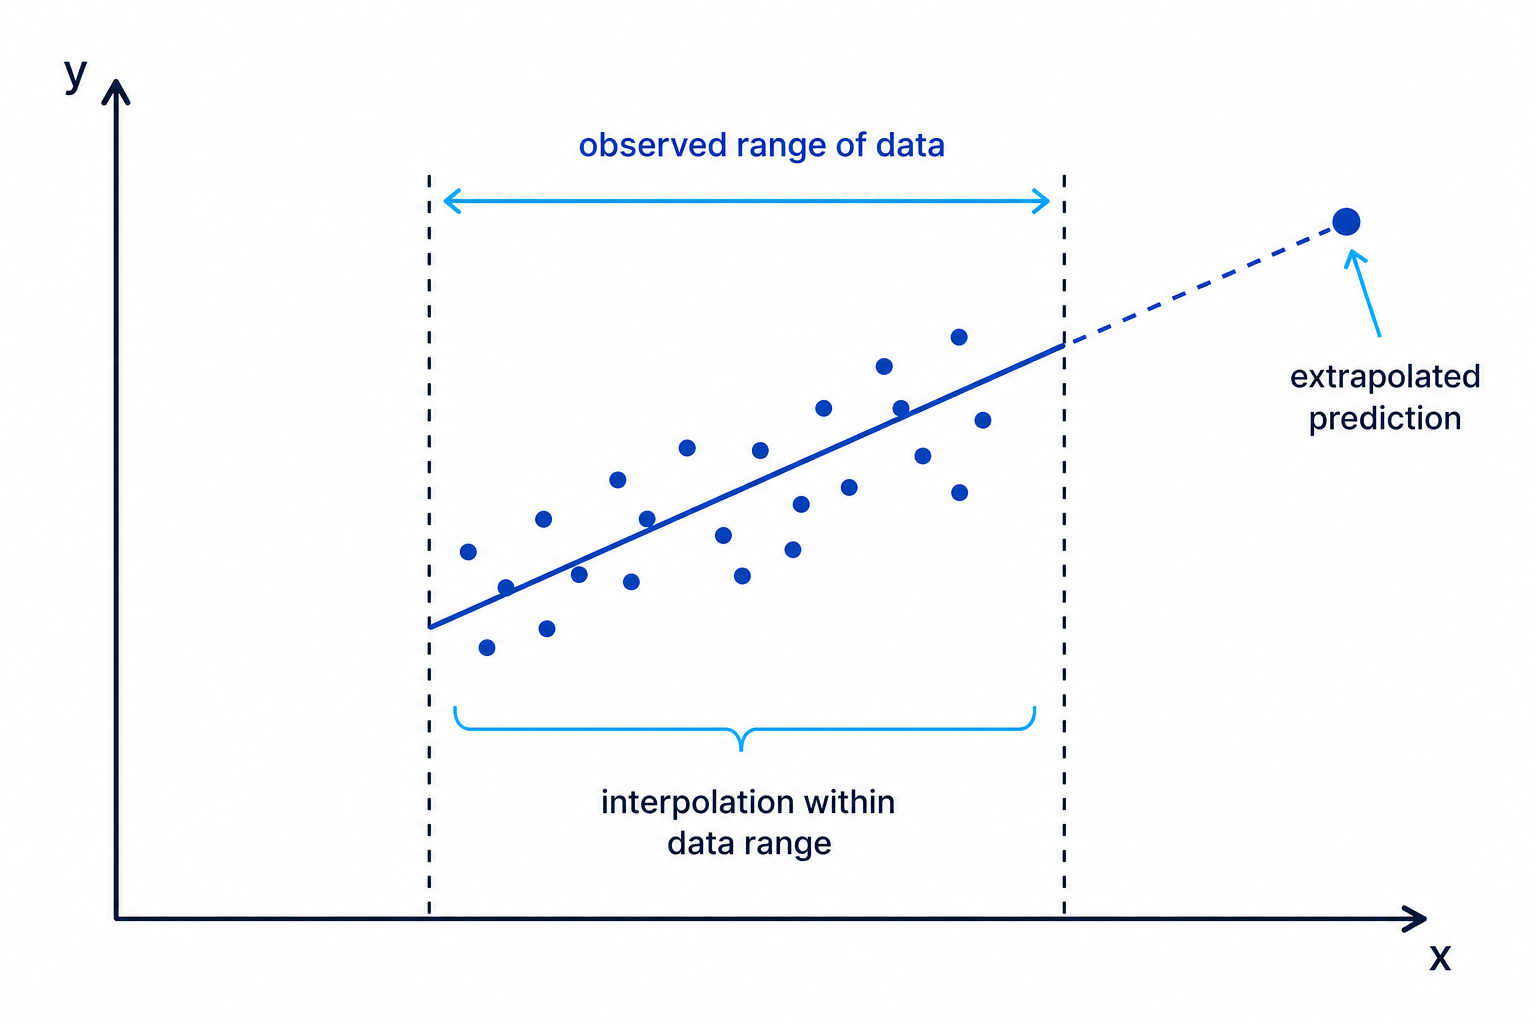
Extrapolation
Extrapolation means using a model outside the range of the original data. Regression predictions become less reliable when you extrapolate.
Hypothesis testing for correlation
A hypothesis test uses sample evidence to decide whether there is enough evidence to reject a starting assumption.
Definition
Hypotheses for correlation
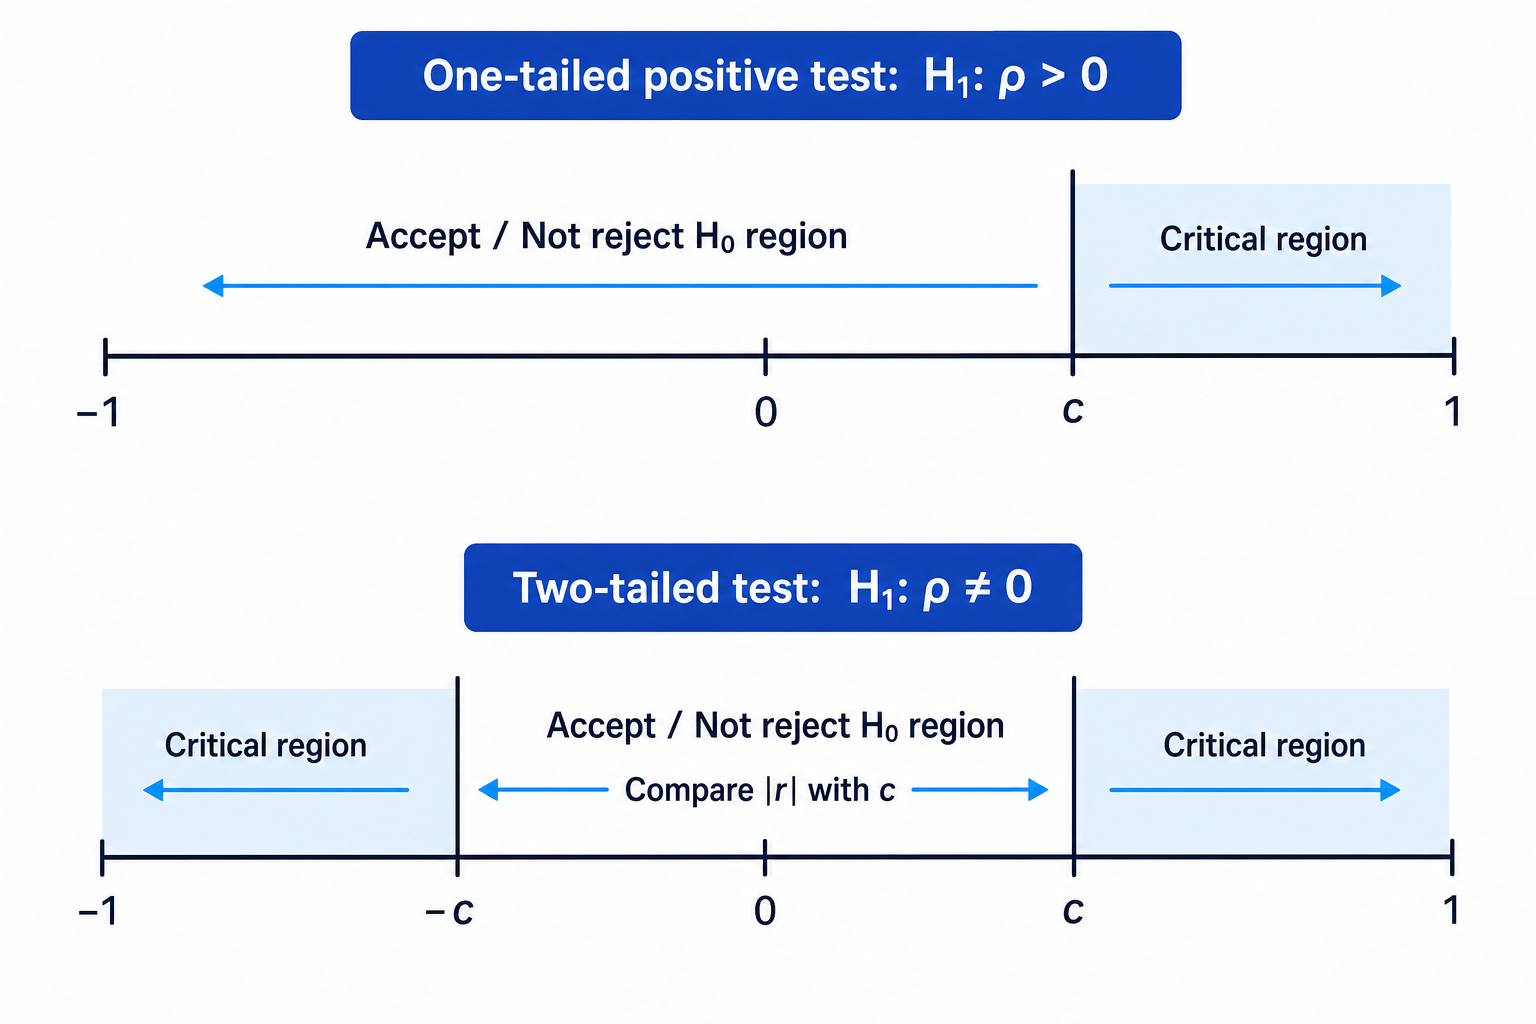
For a PMCC test, the null hypothesis is usually H0:ρ=0H_0:\rho=0H0:ρ=0, meaning no linear correlation in the population. The alternative hypothesis H1H_1H1 says what kind of correlation you are testing for.
Use:
- H1:ρ>0H_1:\rho>0H1:ρ>0 for a positive correlation test;
- H1:ρ<0H_1:\rho<0H1:ρ<0 for a negative correlation test;
- H1:ρ≠0H_1:\rho\neq 0H1:ρ=0 for a two-tailed test for any correlation.
A critical value is the boundary value from the PMCC tables. You compare your sample value of rrr with this value.
One-tailed test
Use a one-tailed test when the question asks for a positive or negative correlation.
Example
Testing for positive correlation
A takeaway owner records temperature and daily sales for 10 days. The PMCC is r=0.67r=0.67r=0.67. Test, at the 5% significance level, whether there is positive correlation.
-
State the hypotheses:
H0:ρ=0,H1:ρ>0H_0:\rho=0,\qquad H_1:\rho>0H0:ρ=0,H1:ρ>0 -
There are 10 pairs of data, so n=10n=10n=10. For a one-tailed 5% test, the critical value is 0.549.
-
Compare the sample PMCC with the critical value:
0.67>0.5490.67>0.5490.67>0.549 -
Since the sample value is in the critical region, reject H0H_0H0.
-
There is sufficient evidence at the 5% level of positive correlation between temperature and daily sales.
Two-tailed test
Use a two-tailed test when the question asks whether there is a correlation, without specifying positive or negative.
Example
Testing for any correlation
A scientist records humidity and air pressure on 14 days. The PMCC is r=−0.55r=-0.55r=−0.55. Test, at the 5% level, whether there is correlation.
-
State the hypotheses:
H0:ρ=0,H1:ρ≠0H_0:\rho=0,\qquad H_1:\rho\neq 0H0:ρ=0,H1:ρ=0 -
There are 14 pairs of data, so n=14n=14n=14. For a two-tailed 5% test, the critical value is 0.532.
-
For a two-tailed test, compare ∣r∣|r|∣r∣ with the critical value:
∣−0.55∣=0.55>0.532|-0.55|=0.55>0.532∣−0.55∣=0.55>0.532 -
Reject H0H_0H0.
-
There is sufficient evidence at the 5% level of correlation between humidity and air pressure. Since rrr is negative, the evidence suggests negative correlation.
Common Mistake
Wrong tail
If the wording says “positive correlation” or “negative correlation”, use a one-tailed test. If it just says “correlation”, use a two-tailed test.
Logarithms and non-linear regression models
Sometimes the original scatter diagram is curved, but a logarithmic transformation makes it straight.
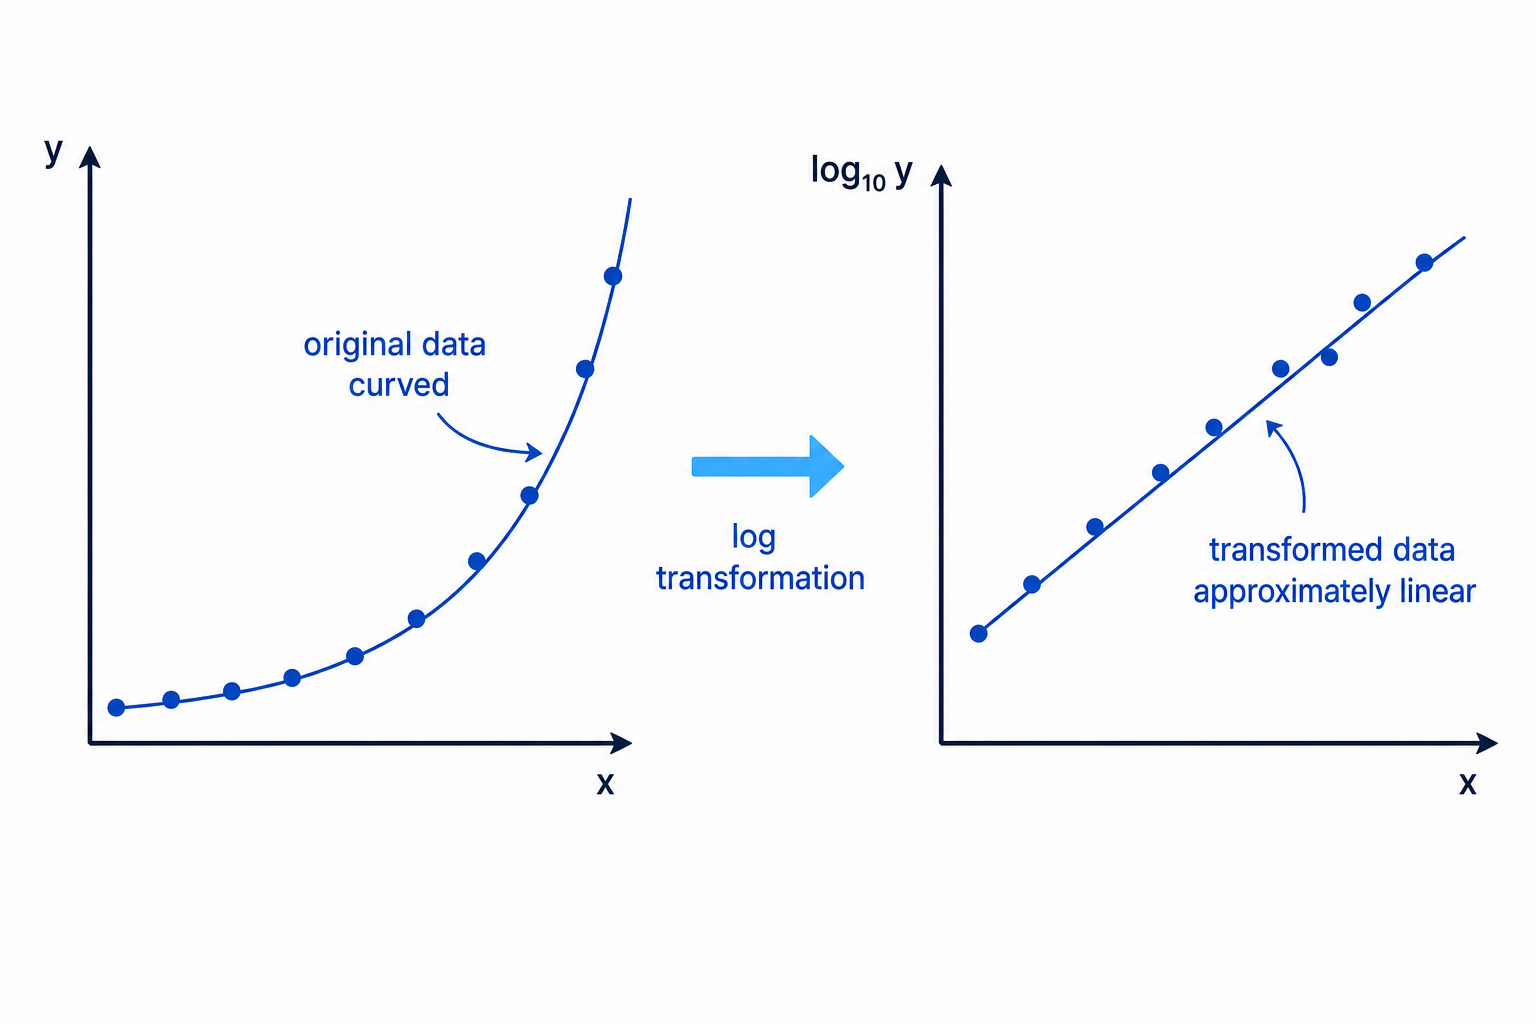
A transformation means replacing a variable with a function of that variable, such as log10y\log_{10}ylog10y.
Exponential models
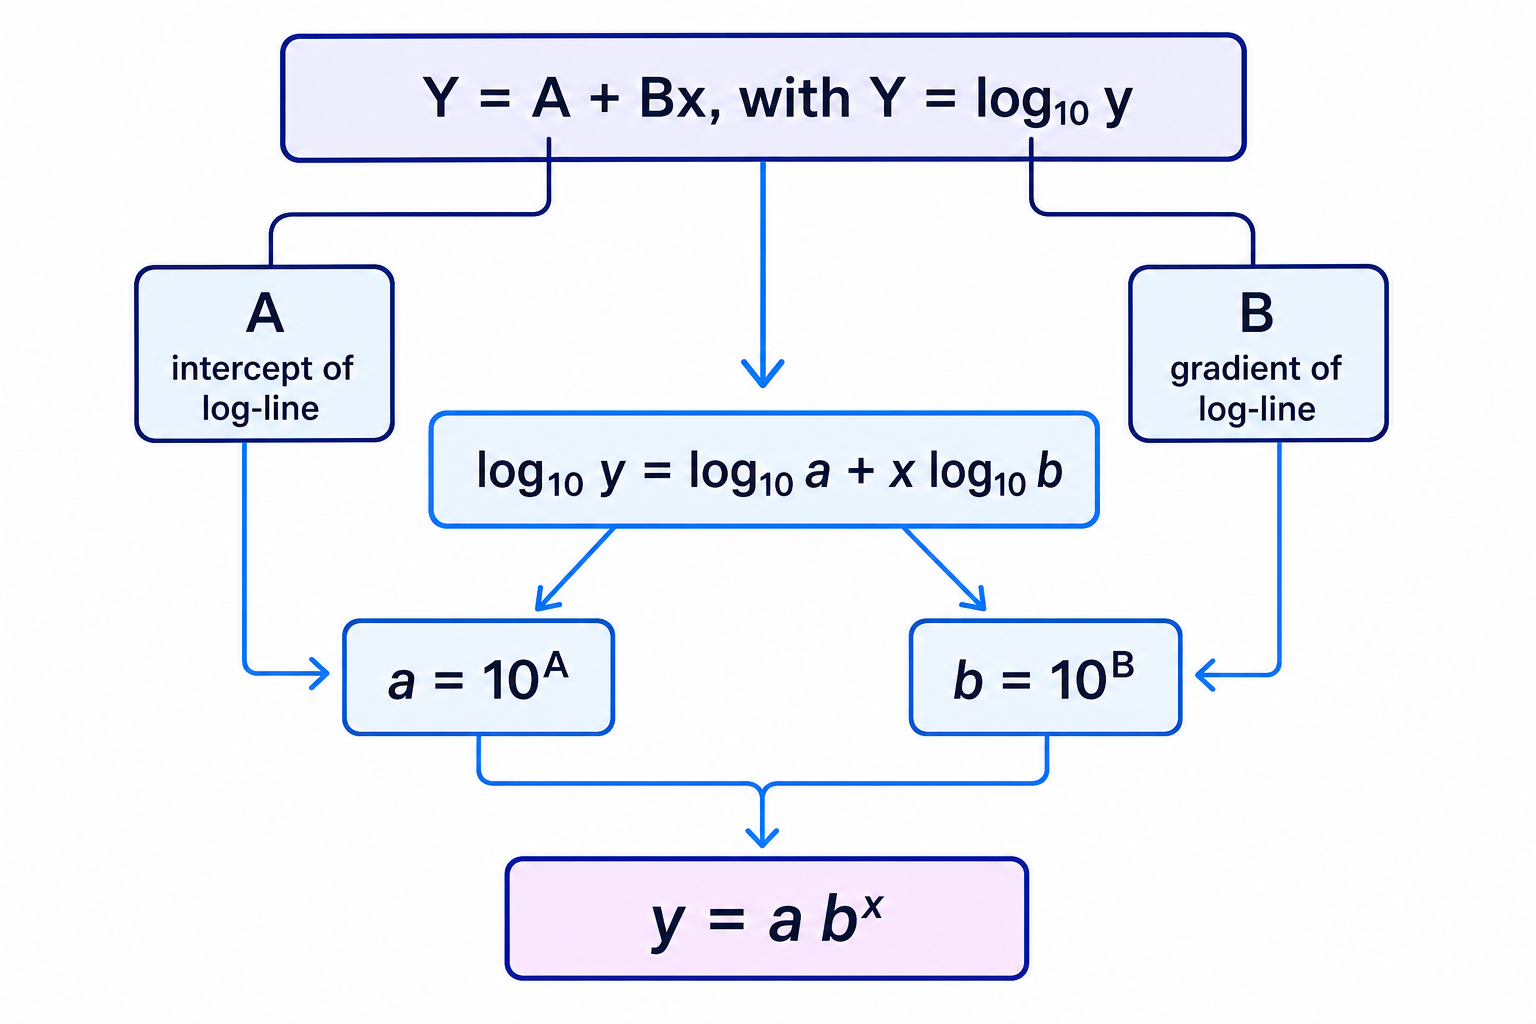
An exponential model has the form
y=abxy=ab^xy=abxTaking logs gives
log10y=log10a+xlog10b\log_{10}y=\log_{10}a+x\log_{10}blog10y=log10a+xlog10bSo if the regression line for Y=log10yY=\log_{10}yY=log10y is
then
a=10A,b=10Ba=10^A,\qquad b=10^Ba=10A,b=10BExample
Finding an exponential model
The temperature of water, www °C, is recorded ttt minutes after boiling. Using Y=log10wY=\log_{10}wY=log10w, the regression line is
Y=1.99−0.031tY=1.99-0.031tY=1.99−0.031tFind a model of the form w=abtw=ab^tw=abt.
-
Compare the line with the exponential log form:
log10w=log10a+tlog10b\log_{10}w=\log_{10}a+t\log_{10}blog10w=log10a+tlog10b -
Identify the constants:
log10a=1.99,log10b=−0.031\log_{10}a=1.99,\qquad \log_{10}b=-0.031log10a=1.99,log10b=−0.031 -
Undo the logarithms:
a=101.99≈97.7,b=10−0.031≈0.931a=10^{1.99}\approx 97.7,\qquad b=10^{-0.031}\approx 0.931a=101.99≈97.7,b=10−0.031≈0.931 -
The model is:
w=97.7(0.931)tw=97.7(0.931)^tw=97.7(0.931)t -
The constant aaa is the predicted temperature when t=0t=0t=0, so here it is about 97.7°C.
Power models
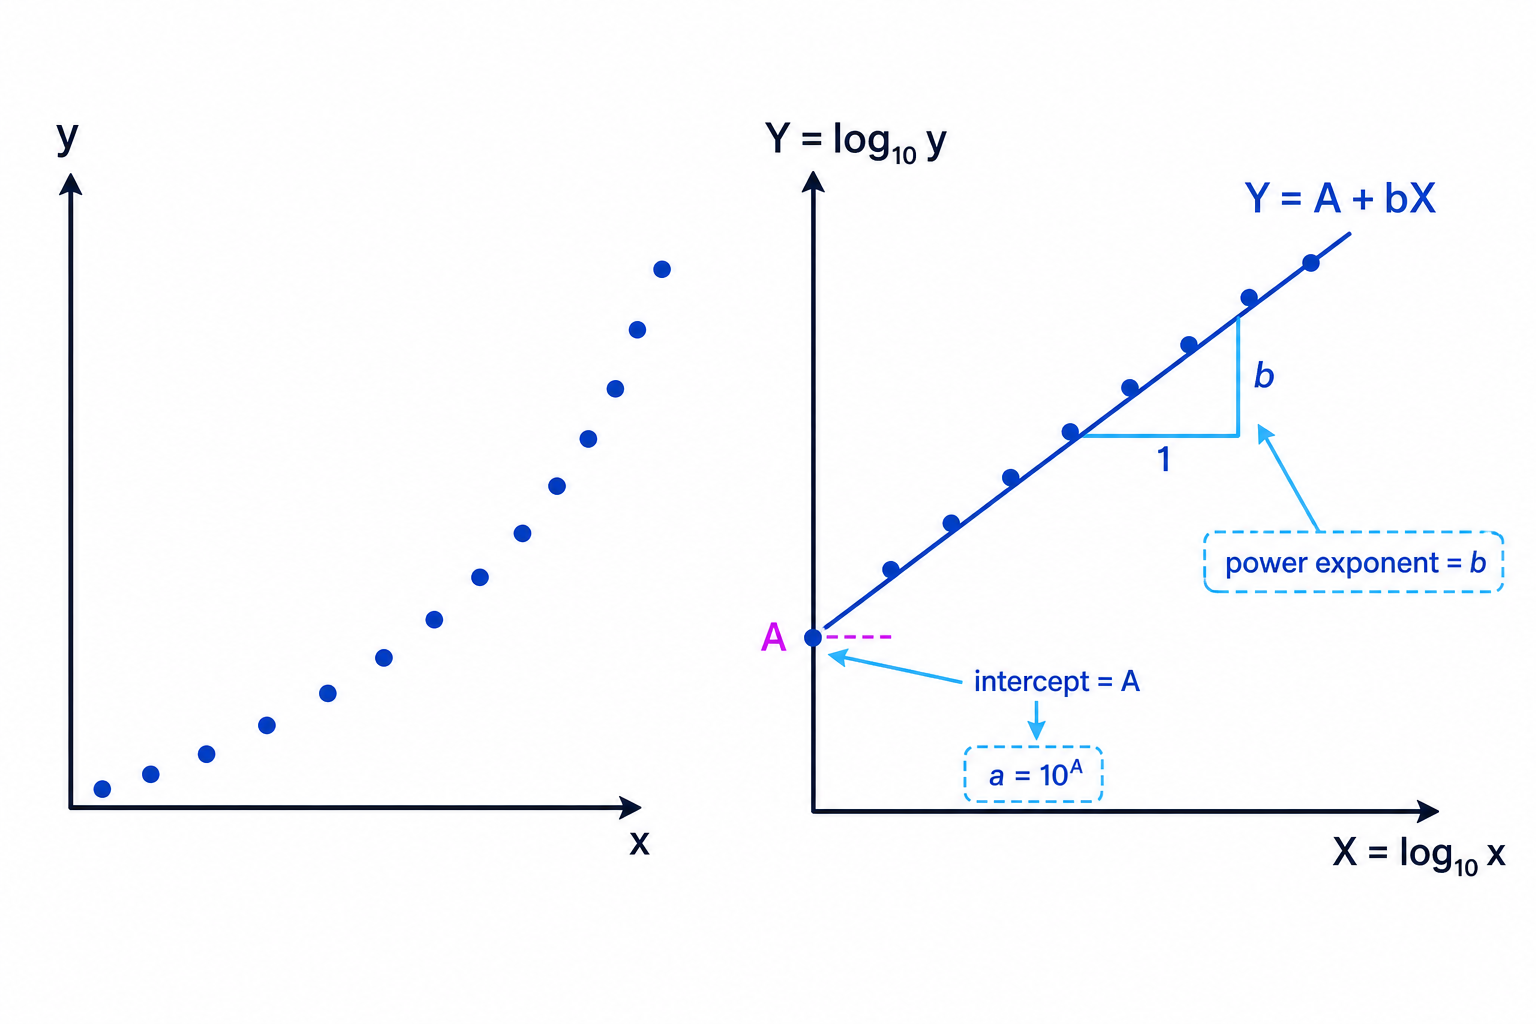
A power model has the form
y=axby=ax^by=axbTaking logs gives
log10y=log10a+blog10x\log_{10}y=\log_{10}a+b\log_{10}xlog10y=log10a+blog10xSo if you set X=log10xX=\log_{10}xX=log10x and Y=log10yY=\log_{10}yY=log10y, a straight-line model supports a power relationship.
Example
Converting a log model to a power model
For two variables xxx and yyy, let m=log10xm=\log_{10}xm=log10x and n=log10yn=\log_{10}yn=log10y. The regression line is
n=0.25−0.16mn=0.25-0.16mn=0.25−0.16m-
Substitute back into the original variables:
log10y=0.25−0.16log10x\log_{10}y=0.25-0.16\log_{10}xlog10y=0.25−0.16log10x -
Identify the power-model constants:
log10a=0.25,b=−0.16\log_{10}a=0.25,\qquad b=-0.16log10a=0.25,b=−0.16 -
Undo the logarithm for aaa:
a=100.25≈1.78a=10^{0.25}\approx 1.78a=100.25≈1.78 -
Write the model:
y=1.78x−0.16y=1.78x^{-0.16}y=1.78x−0.16 -
If the PMCC for the transformed variables is closer to -1 or 1 than the original PMCC, that supports using the transformed model.
Common Mistake
Forgetting the inverse log
If the intercept in a base-10 log equation is AAA, then the original constant is 10A10^A10A, not just AAA.
Exam technique
In the exam
-
Decide the test type from the wording: “positive” or “negative” means one-tailed; “correlation” means two-tailed.
-
Write hypotheses using ρ\rhoρ, not rrr. Use rrr only for the sample PMCC you compare with the critical value.
-
Give a conclusion in context using “sufficient evidence” or “insufficient evidence”; do not say the result proves causation.
Self review
Check yourself
-
Can you choose the correct alternative hypothesis for positive, negative and two-tailed correlation tests?
-
Can you interpret the gradient of a regression line in context, including the correct units?
-
Can you convert a line involving log10y\log_{10}ylog10y into an exponential or power model?

Recap questions
Test yourself with 5 quick questions on this guide. Answer them all correctly to complete it.
You've reached the end
Test yourself on this topic, or move on to the next guide.
How was this guide?