Question 38
The mass of an apple of a particular variety, in grams, is modelled by a Normal distribution with mean 150 g and standard deviation 10 g.
This Normal distribution is represented in the diagram below.
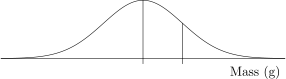
Label the values 150 and 160 on the horizontal axis.
4.5 Statistical distributions (A-level only) Questions
284 exam-style questions on CCEA A Level Maths 4.5 Statistical distributions (A-level only), covering 4.5.1 Statistical distributions (A-level only) and 4.5.2 Statistical distributions (A-level only). Each one has a worked solution and a mark scheme showing where the marks go.