Opportunity cost
What you'll learn
- Why scarce resources — limited inputs such as land, labour, capital and enterprise — force people, firms and governments to make choices.
- The difference between a trade-off and an opportunity cost.
- How a production possibility curve (PPC) shows movements, shifts and the cost of choosing more of one output.
- Why opportunity cost is a powerful idea, but not always easy to measure in the real world.
The starting point: scarcity and choice
Economics begins with a simple problem: human wants are unlimited, but resources are limited. You may want more time, more income, better public services, cheaper food and a cleaner environment — but not everything can be achieved at once.
Because resources are scarce, every economic agent — a decision-maker such as a consumer, firm or government — has to make choices.
Scarcity
Scarcity means that there are not enough resources to satisfy all wants. It forces choices about how resources are allocated between competing uses.
The factors of production are the inputs used to produce goods and services:
- Land: natural resources, such as oil, farmland or wind power sites.
- Labour: human effort, skills and time.
- Capital: human-made resources used to produce output, such as machinery, roads and computers.
- Enterprise: the willingness and ability to organise production and take risks.
A good is a physical product, such as a phone. A service is an activity, such as a haircut or GP appointment.
Trade-offs
A trade-off happens when gaining more of one thing means giving up some of another. In economics, trade-offs are everywhere.
For example:
- A student who spends more time on Economics revision has less time for Biology revision.
- A firm that spends more on advertising may have less available for staff training.
- A government that allocates more resources to defence may have fewer resources available for hospitals, schools or tax cuts.
Trade-off
A trade-off is a situation where choosing more of one objective, good or service means accepting less of another.
Trade-offs do not always involve money. Time, land, attention and skilled workers are all scarce too.
Opportunity cost
Opportunity cost takes the idea of a trade-off one step further. It asks: what is the best alternative you give up when you make a choice?
Opportunity cost
Opportunity cost is the value of the next best alternative foregone when a choice is made.
The phrase next best alternative is crucial. If you reject ten possible options, the opportunity cost is not all ten added together. It is the best one you did not choose.
The core idea
Opportunity cost is not “what you paid”. It is what you gave up by choosing one option instead of the next best alternative.
Calculating an opportunity cost
A local council has enough funding to either repair 10 bridges or build 4 sports centres. It chooses to build the sports centres.
-
Identify the chosen option: the council builds 4 sports centres.
-
Identify the next best alternative foregone: repairing 10 bridges.
-
State the total opportunity cost: the opportunity cost of building 4 sports centres is 10 bridge repairs.
-
Calculate the opportunity cost per sports centre:
- Interpret the result: for each sports centre built, the council gives up the chance to repair 2.5 bridges, on average.
Counting every rejected option
Do not define opportunity cost as “all the alternatives given up”. It is the next best alternative foregone, not every possible alternative.
Production possibility curves
A production possibility curve (PPC) shows the maximum possible combinations of two goods or services that can be produced using existing resources and technology efficiently.
Production possibility curve
A production possibility curve is a diagram showing the maximum combinations of two outputs an economy can produce when resources are fully and efficiently used, assuming the level of technology is fixed.
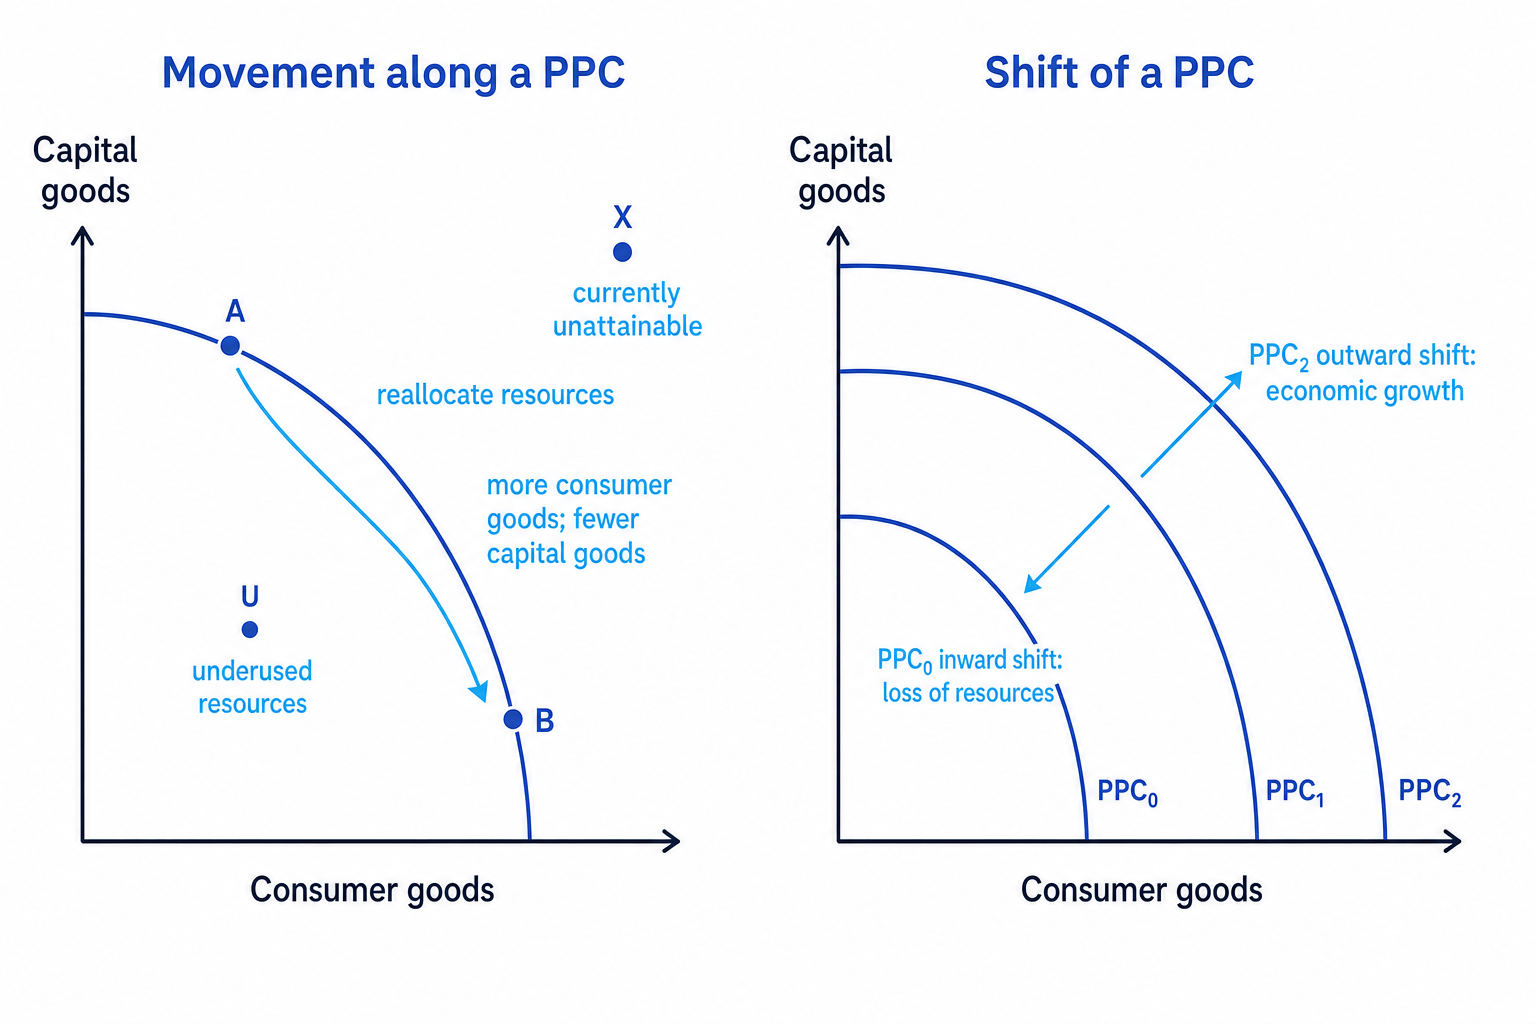
A PPC usually has:
- One output on the horizontal axis.
- Another output on the vertical axis.
- A downward-sloping curve, because producing more of one output means producing less of the other.
- Points on the curve, showing productive efficiency — producing the maximum possible output from available resources.
- Points inside the curve, showing unemployed or underused resources.
- Points outside the curve, showing output combinations that are currently unattainable.
The diagram below shows both a movement along a PPC and shifts of a PPC.
Movements along a PPC
A movement along a PPC means the economy is changing its output combination while using the same overall resources and technology. It is reallocating resources from one use to another.
For example, an economy may move from producing many capital goods and fewer consumer goods to producing more consumer goods and fewer capital goods.
Capital and consumer goods
Capital goods are goods used to produce other goods and services, such as machinery and factories. Consumer goods are goods bought by households for direct satisfaction, such as food, clothes and phones.
A movement along the PPC shows opportunity cost directly. If you move rightwards to produce more consumer goods, you must move downwards and produce fewer capital goods.
The slope of the PPC shows the rate at which one good must be given up to produce more of the other. A bowed-out PPC shows increasing opportunity cost: as more of one good is produced, larger amounts of the other good must be sacrificed.
Opportunity cost on a PPC movement
An economy moves from point A to point B on the same PPC. At A, it produces 20 million consumer goods and 80 million capital goods. At B, it produces 50 million consumer goods and 60 million capital goods.
-
Calculate the increase in consumer goods: output rises from 20 million to 50 million, so the economy gains 30 million consumer goods.
-
Calculate the decrease in capital goods: output falls from 80 million to 60 million, so the economy gives up 20 million capital goods.
-
State the total opportunity cost: the opportunity cost of gaining 30 million consumer goods is 20 million capital goods.
-
Calculate the average opportunity cost per extra consumer good:
- Interpret the result: each extra consumer good costs about 0.67 capital goods on average over this movement.
Movement or shift?
If the economy is moving from one point to another on the same PPC, it is reallocating existing resources. If the whole PPC moves, productive potential has changed.
Shifts of a PPC
A shift of a PPC means the economy’s productive potential has changed. This is different from simply changing the mix of goods produced.
An outward shift means the economy can now produce more than before. This represents an increase in productive potential, often called potential economic growth.
Causes of an outward PPC shift include:
- Investment in new capital goods.
- Improvements in technology, such as automation or AI.
- Better education and training, increasing labour productivity.
- Discovery of new natural resources.
- Higher labour force participation or immigration.
- Improved infrastructure, such as transport, broadband or energy networks.
An inward shift means the economy can produce less than before. This could be caused by war, natural disasters, loss of skilled workers, depreciation of capital, or severe supply-chain disruption.
Economic growth
Economic growth means an increase in output. Actual growth means more goods and services are produced now; potential growth means the economy’s maximum possible output has increased.
A shift can be balanced, where both types of output can increase, or biased, where only one sector’s capacity improves. For example, a breakthrough in green energy technology may shift the PPC outward more strongly for energy-intensive industries than for other sectors.
Identifying a PPC shift
Suppose the UK invests heavily in technical education and advanced manufacturing equipment.
-
Decide whether productive potential changes: better skills and equipment increase the maximum output workers and firms can produce.
-
Decide the direction of the PPC shift: because the economy can now produce more than before, the PPC shifts outwards.
-
Link to opportunity cost: the investment may require giving up some current consumption, but it can increase future productive capacity.
-
Add real-world application: green-transition spending, such as investment in renewable energy infrastructure, may reduce current resources available for other public spending but raise future productive potential.
Confusing lower unemployment with growth in potential
If unemployed resources are brought back into use, the economy moves from inside the PPC towards the curve. The PPC itself only shifts outwards if the economy’s productive capacity increases.
Why opportunity cost is useful
Opportunity cost is useful because it makes decision-making more realistic. It reminds you that resources have alternative uses.
For consumers, it helps explain choices about spending and time. If you spend £30 on a takeaway, the opportunity cost may be the cinema trip or savings you give up.
For firms, it supports decisions about resource allocation. A business choosing to expand online sales may give up investment in physical stores.
For governments, it is essential. Public spending decisions involve major trade-offs: more NHS funding, defence spending, tax cuts, debt interest payments, welfare support, infrastructure or climate policies. During the UK cost-of-living squeeze, for example, support for household energy bills involved an opportunity cost because those funds could have been used for other public services or lower borrowing.
Opportunity cost as an economic lens
Opportunity cost helps economists ask a sharper question: not just “is this option good?”, but “is this option better than the next best alternative?”
Evaluating the usefulness of opportunity cost
Opportunity cost is powerful because it highlights hidden costs. The monetary cost of university is not only tuition fees; it may also include income foregone from working full-time. The cost of protecting greenbelt land may include fewer houses being built. The cost of building more houses may include environmental damage or lost farmland.
However, opportunity cost can be difficult to measure precisely.
Some alternatives have uncertain future benefits. For example, the long-run benefits of transport investment, early-years education or climate adaptation are hard to calculate accurately. Some costs are intangible, such as stress, biodiversity loss or reduced community cohesion.
Opportunity cost also depends on the stakeholder. A new airport runway may create jobs and business opportunities, but local residents may face noise and pollution. The “best alternative foregone” may look different depending on whether you are a firm, worker, taxpayer or homeowner.
A final limitation is that choices are dynamic. Producing more capital goods today may mean fewer consumer goods now, but it can shift the PPC outwards in the future. So the opportunity cost of investment needs to be judged over time, not just at one moment.
Overall, opportunity cost is one of the most useful ideas in economics because it disciplines decision-making. But in evaluation, you should recognise that measuring the next best alternative can be uncertain, subjective and affected by time horizons.
In the exam
-
Define opportunity cost precisely as the next best alternative foregone, not just “a cost” or “all alternatives”.
-
On PPC diagrams, label both axes, the curve, and any points or arrows. Explain whether you are showing a movement along the PPC or a shift of the PPC.
-
For movements along a PPC, state what increases, what decreases, and therefore what the opportunity cost is.
-
For evaluation, discuss measurement problems, uncertainty, time horizons and different stakeholder impacts before reaching a judgement.
Check yourself
- If a government spends £5 billion on defence instead of hospitals, what exactly is the opportunity cost?
- What is the difference between moving from inside a PPC to the curve and shifting the PPC outwards?
- Why might producing more capital goods today increase an economy’s future productive potential?
