Skip to content
MathsGenie logo
Open app

Course home

  1. A Level
  2. Economics OCR
  3. Question bank

Government intervention

EasyMediumHard
123456789101112131415161718192021
Question 13

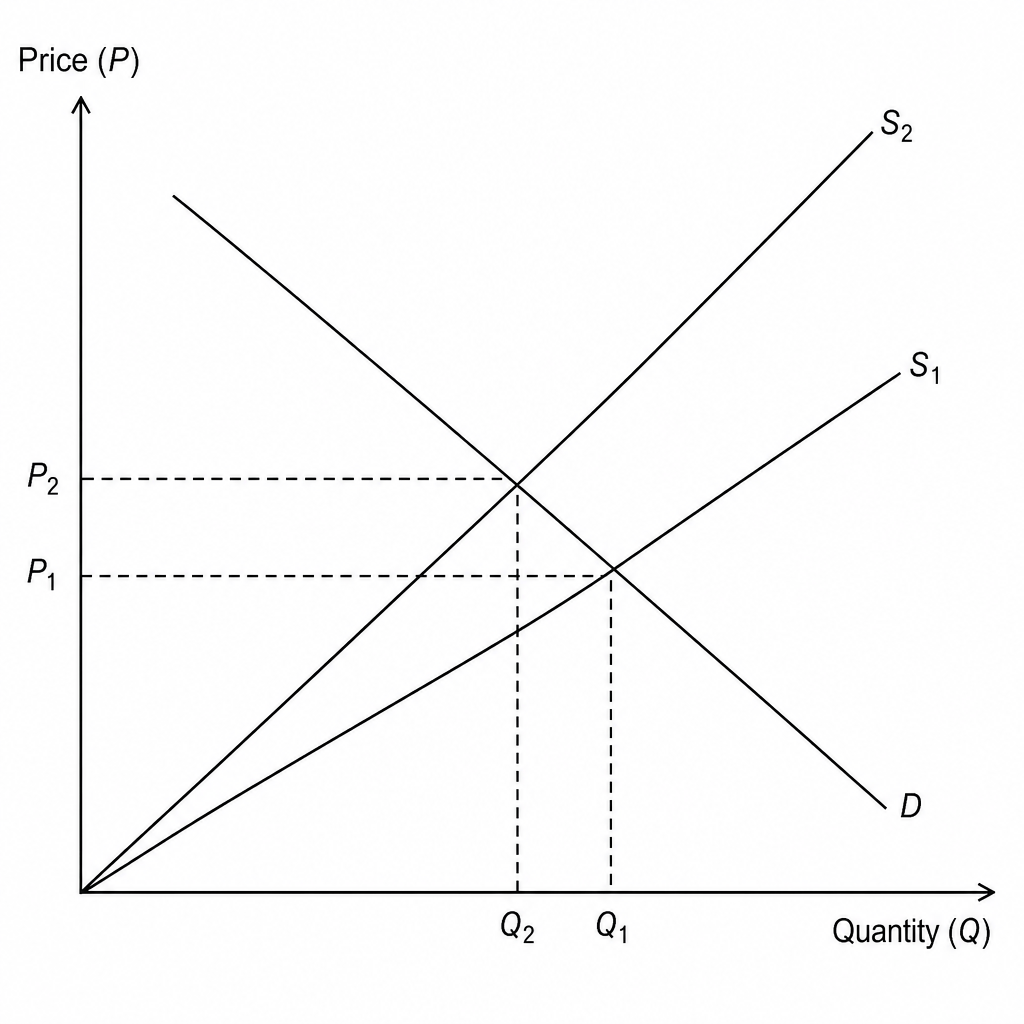
The diagram below shows the market for a luxury good where a government intervention has shifted the market supply curve from S1 S_1\,S1​ to S2S_2S2​.

Market diagram showing supply curve shift

Which of the following government policies is represented by this shift?

A specific indirect tax

An ad valorem indirect tax

A flat-rate producer subsidy

A price floor (minimum price)

Government intervention Questions

  1. A Level
  2. /Economics
  3. /Government intervention