1.5.3a The perfectly competitive model and its assumptions
Perfect Competition Rests on Four Key Assumptions
Definition
Perfect competition: a market structure with many buyers and sellers, an identical product, freedom of entry and exit and perfect knowledge, in which firms are price takers.
- Perfect competition assumes a very large number of buyers and sellers.
- It assumes a homogeneous product, free entry and exit, and perfect knowledge.
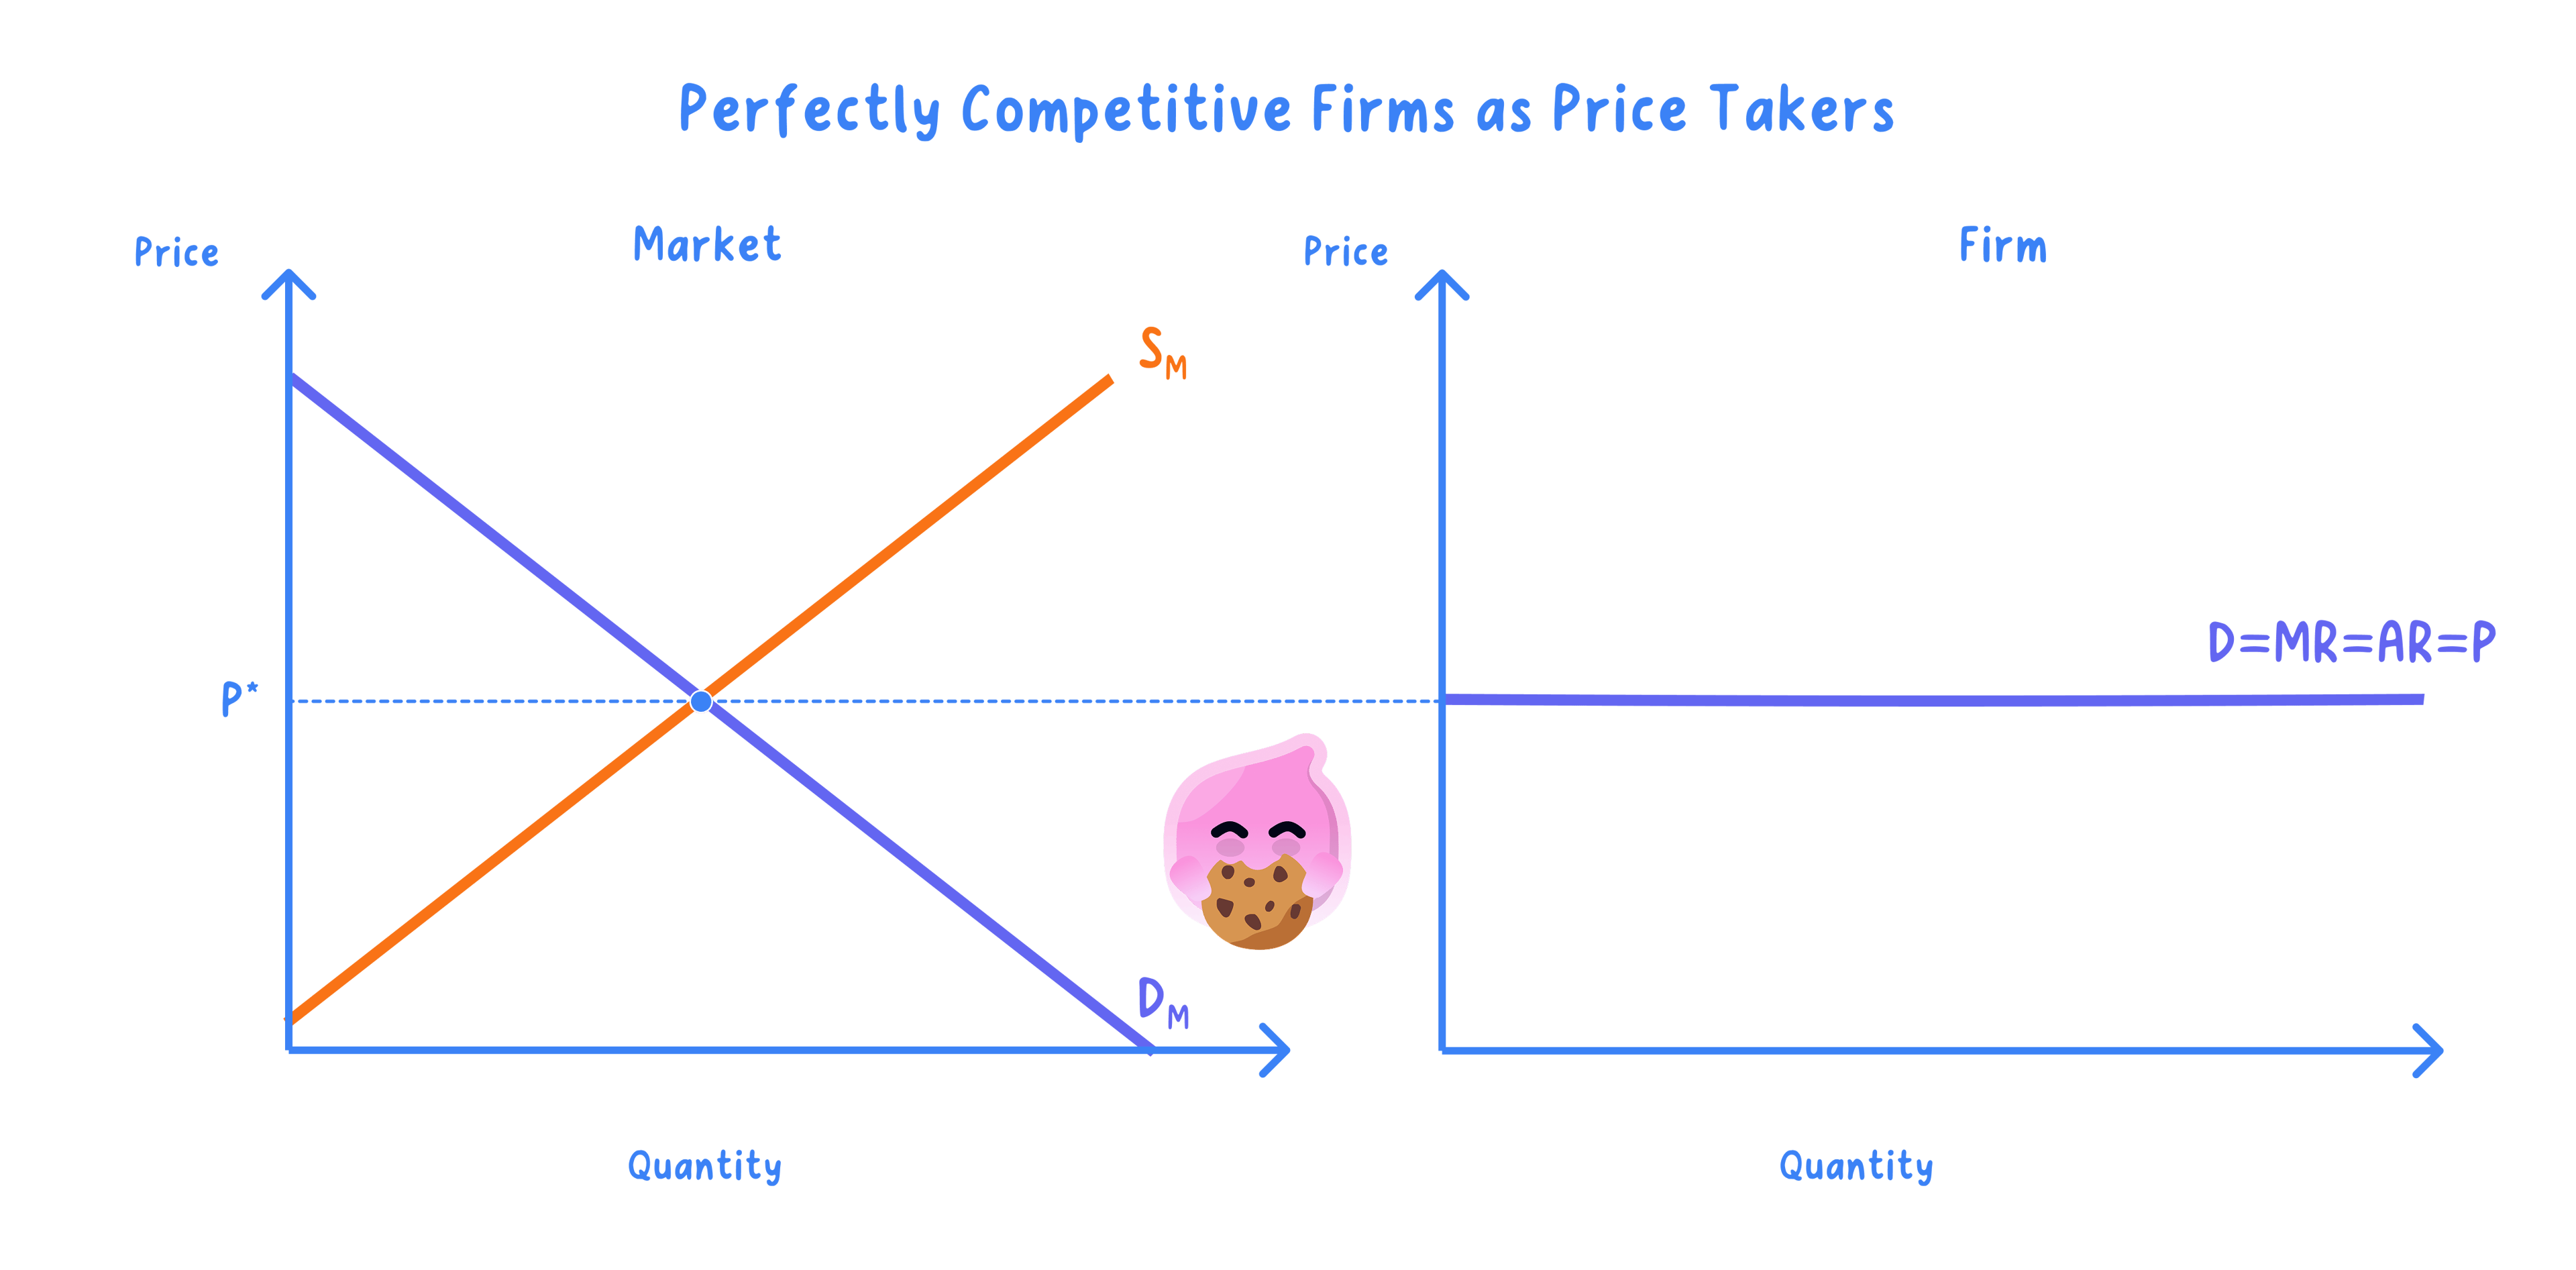
- These assumptions make each firm a price taker.
Note
- The firm faces a horizontal demand curve at the market price.
- So for the firm, average revenue equals marginal revenue equals price.
Each Firm Is Too Small and Undifferentiated to Set Its Own Price
- Each firm is tiny relative to the whole market.
- Its product is identical to every rival's, so it cannot charge more.
- Buyers have perfect knowledge and would switch instantly.
Example
- A single wheat farmer must accept the going market price.
- Charging a penny more would lose all the farmer's customers.
The Market Sets the Price and the Firm Takes It as Given
- The market demand and supply set the price.
- The individual firm then takes that price as given.
- Its own demand curve is horizontal at that price.
Short-Run Profit or Loss Is Competed Away to Normal Profit in the Long Run
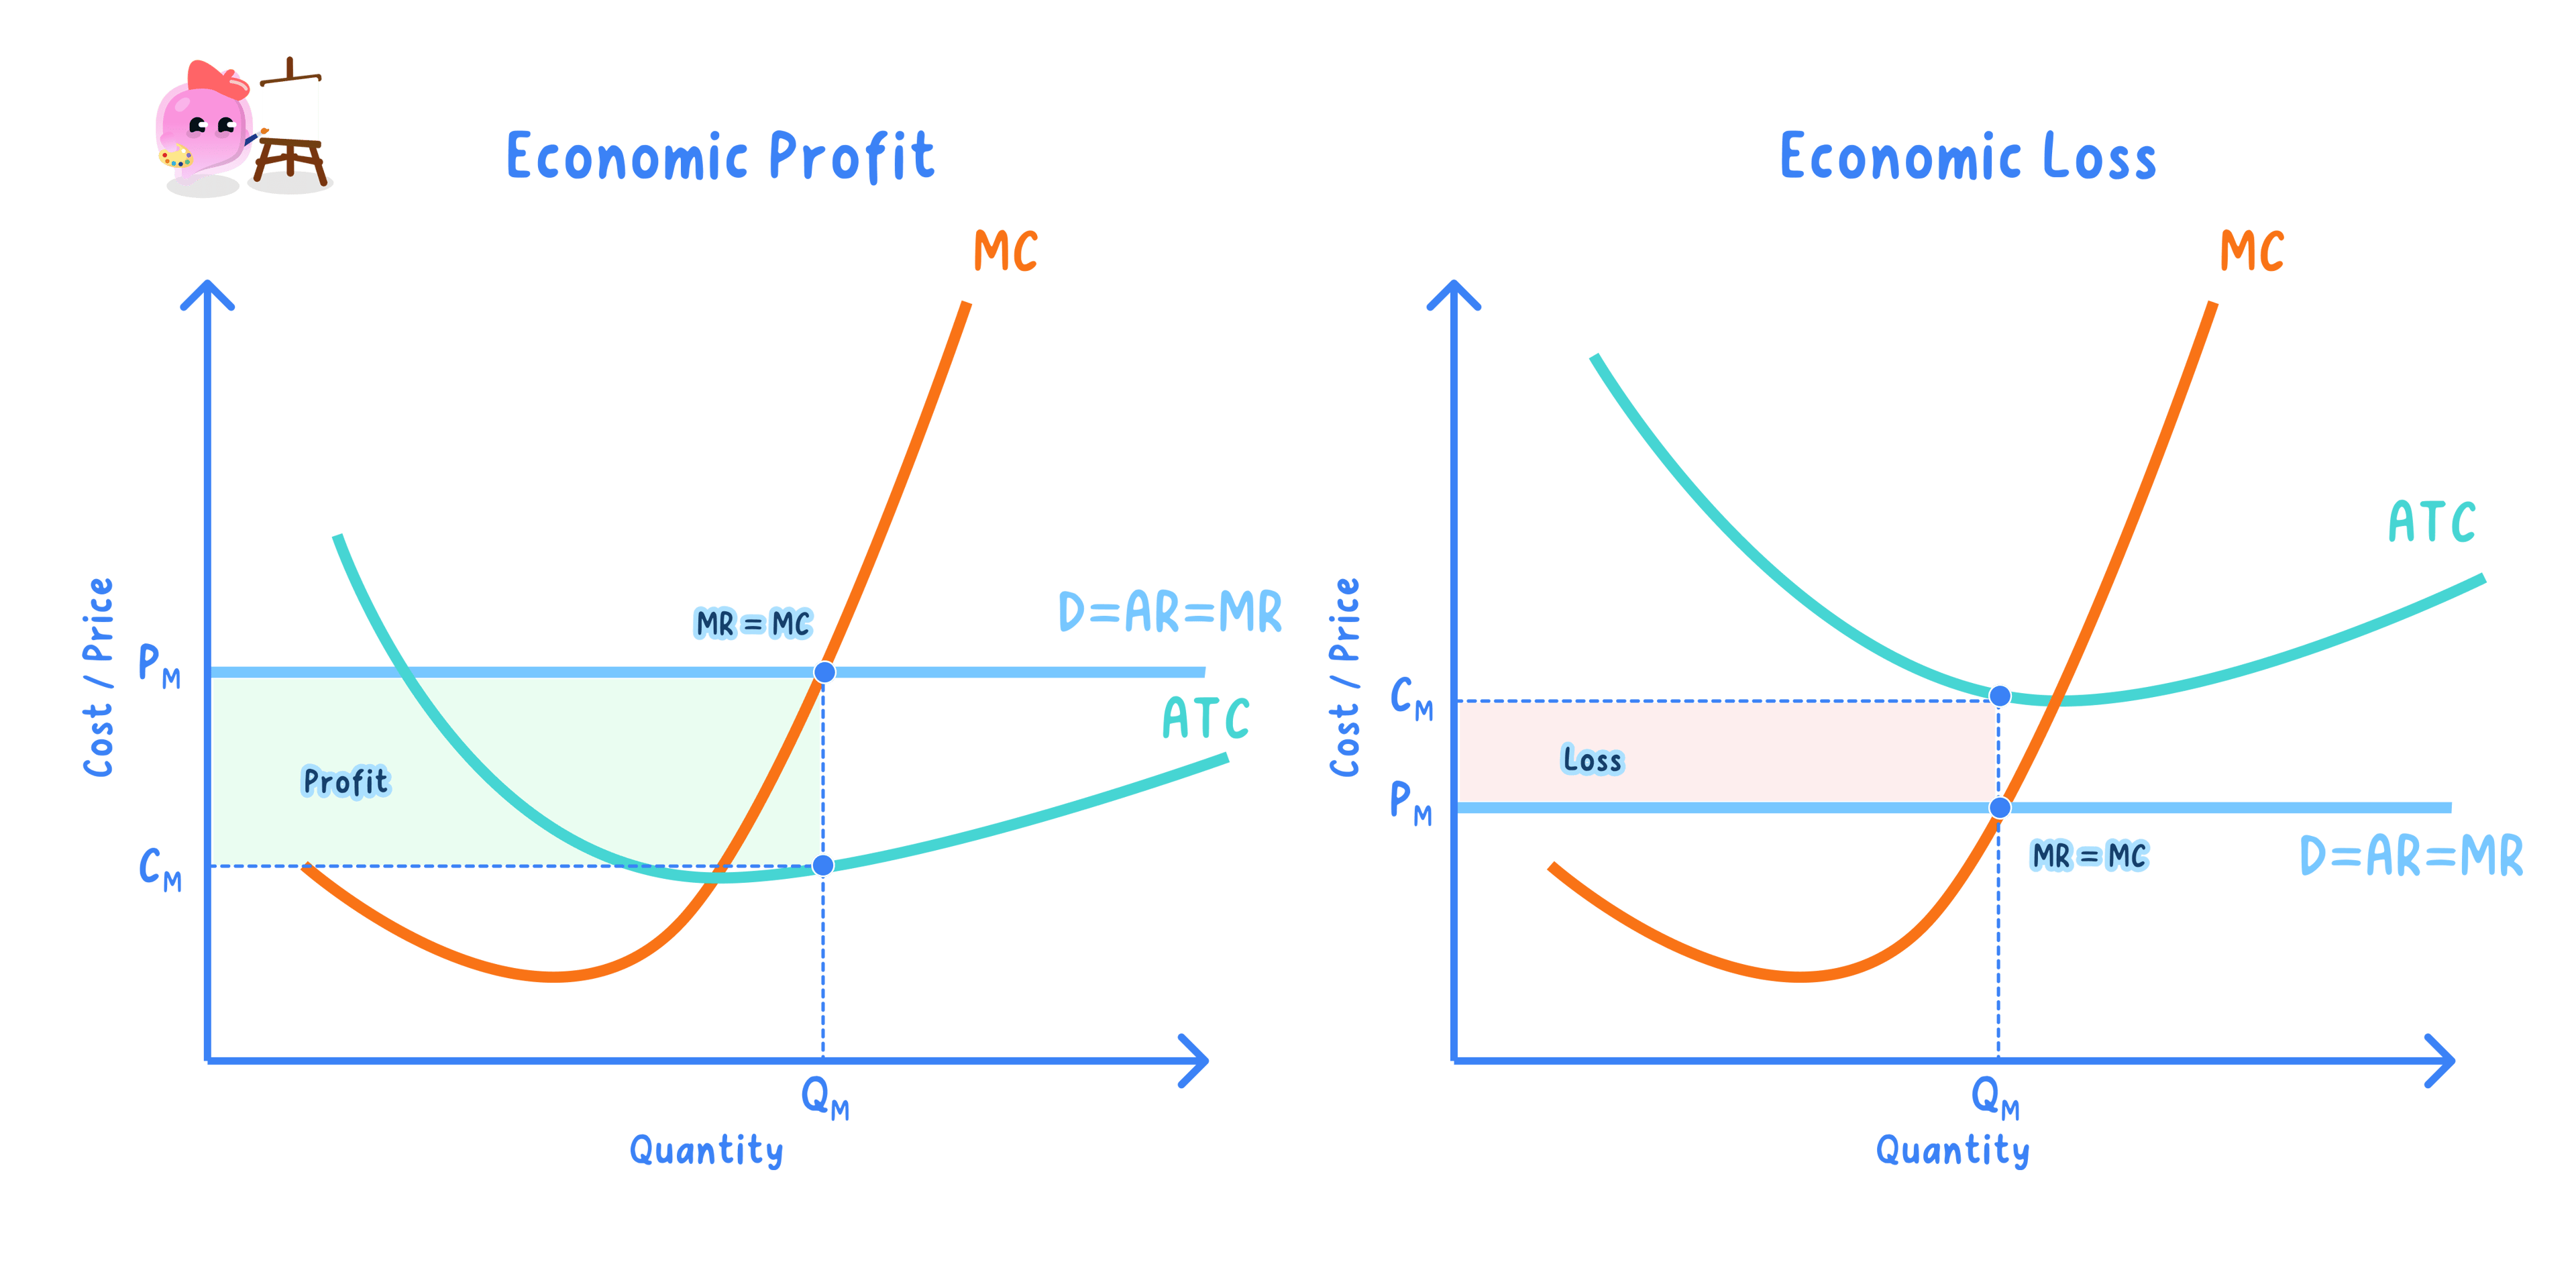
- In the short run the firm maximises profit where MC=MR\text{MC} = \text{MR}MC=MR, and as a price taker this is where MC=MR=AR=price\text{MC} = \text{MR} = \text{AR} = \text{price}MC=MR=AR=price; here it can make supernormal profit when AR>AC\text{AR} > \text{AC}AR>AC, normal profit when AR=AC\text{AR} = \text{AC}AR=AC, or a loss when AR<AC\text{AR} < \text{AC}AR<AC.
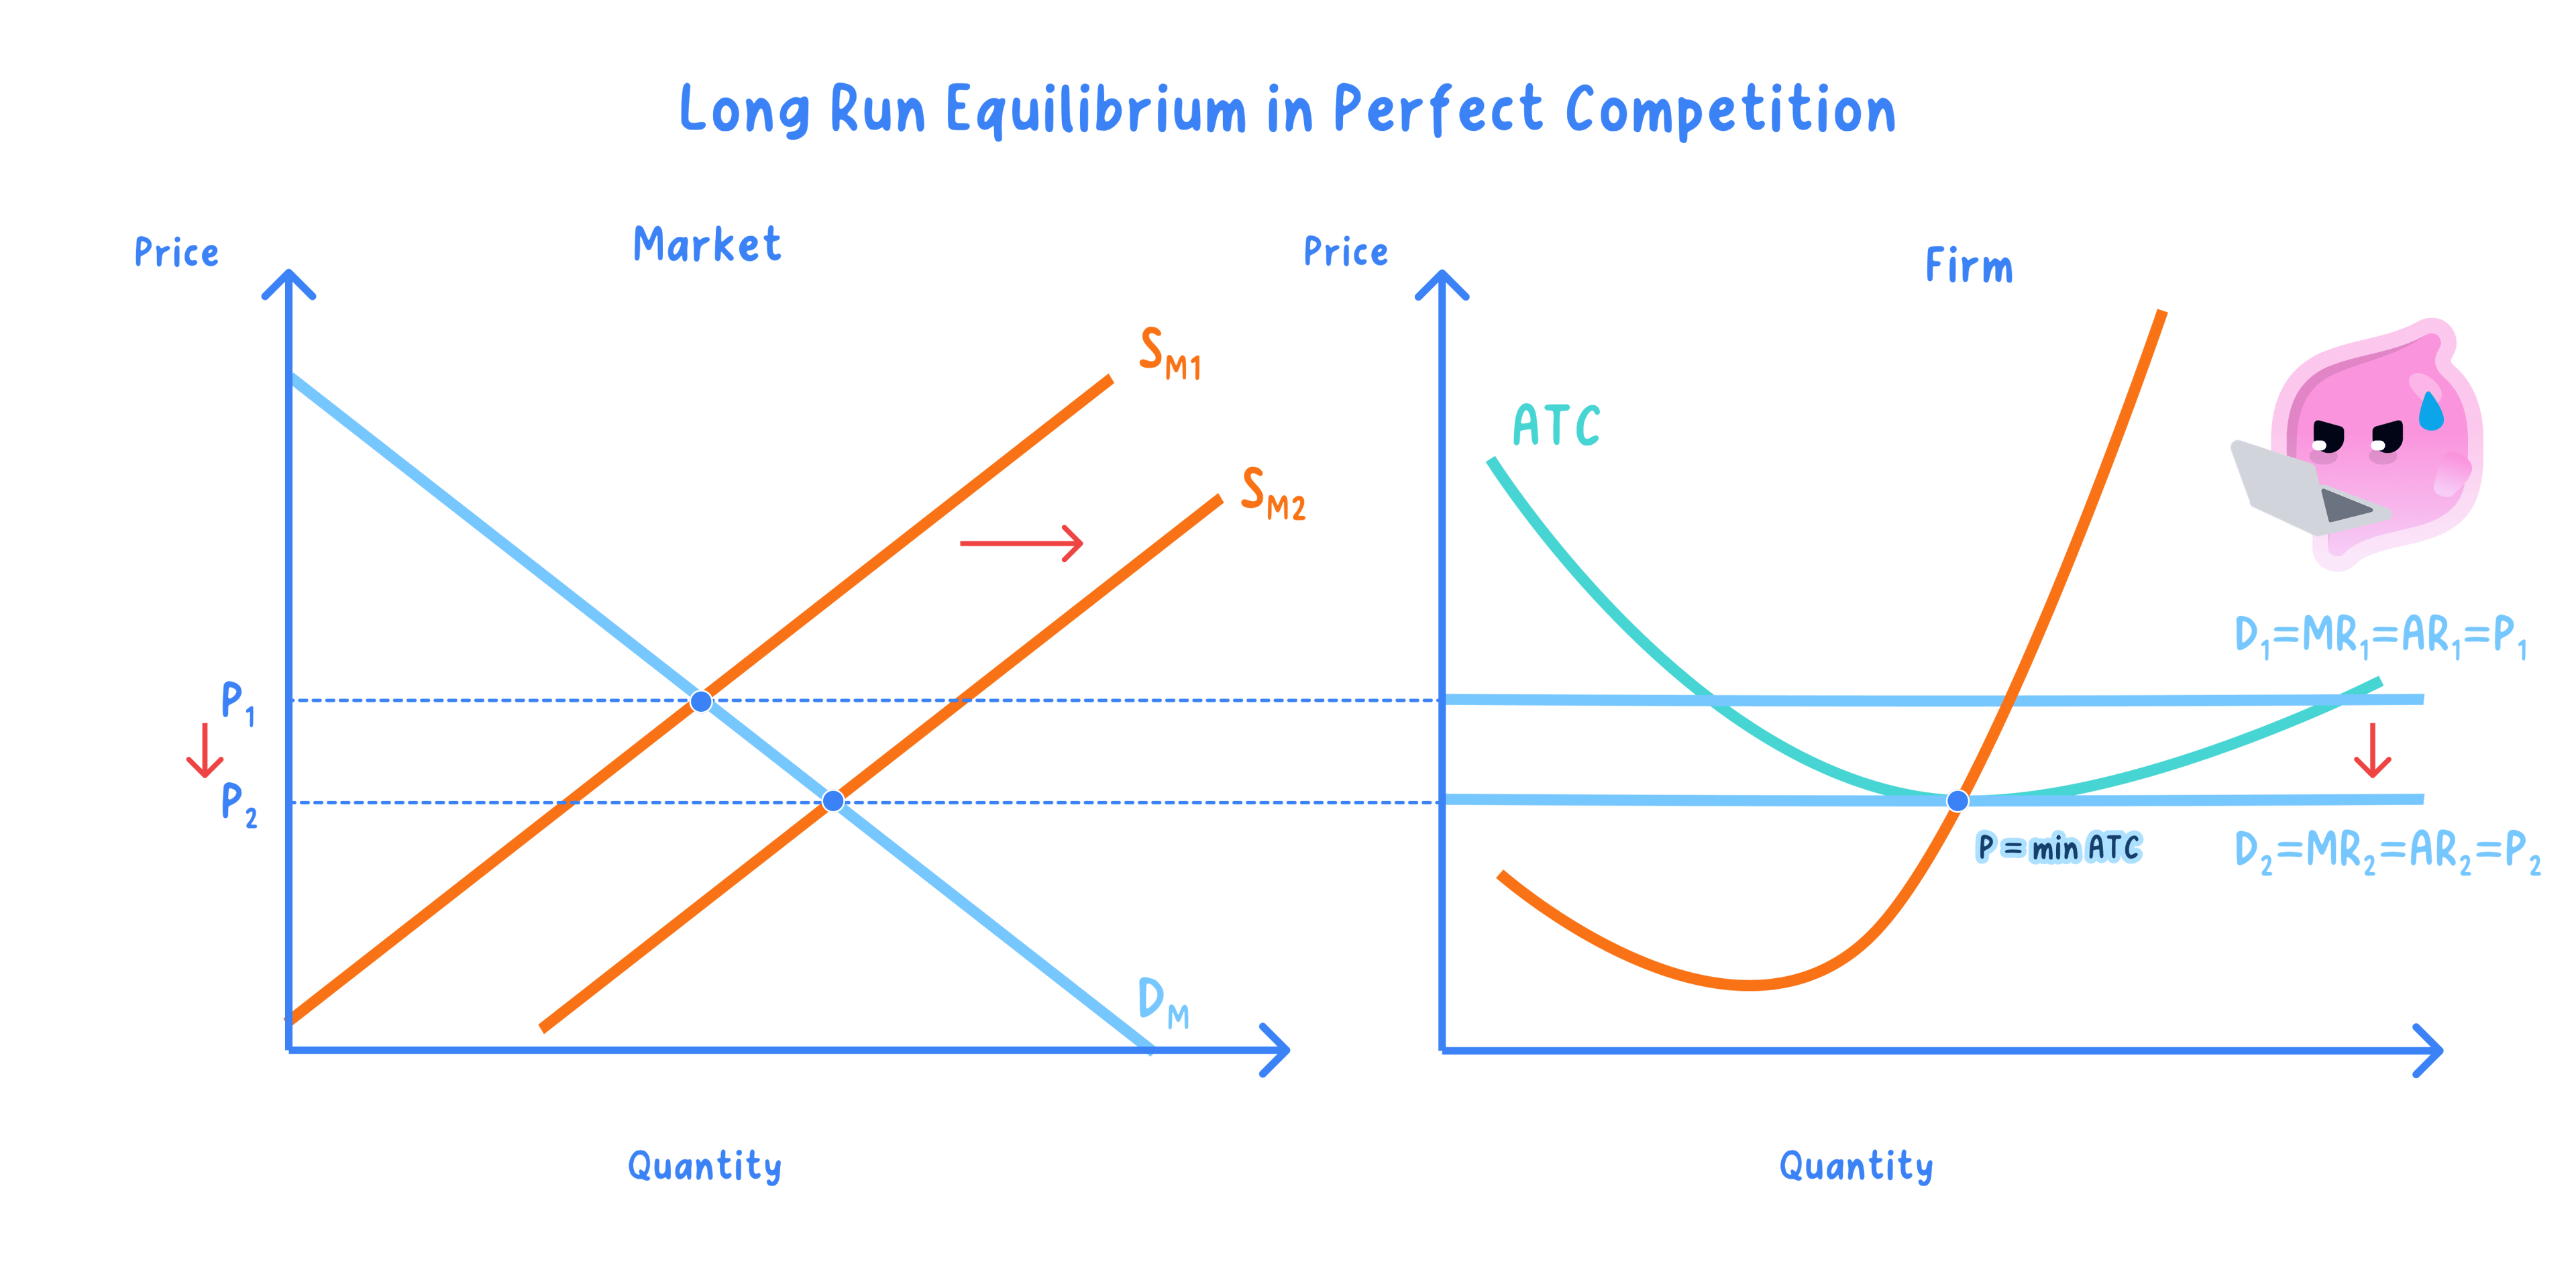
- Because entry and exit are free, supernormal profit attracts new firms into the industry, while losses cause some existing firms to leave.
- Entry raises market supply and pushes the price down, while exit lowers supply and pushes the price up, so the price moves until it reaches the level where AR=AC\text{AR} = \text{AC}AR=AC.
- So in long-run equilibrium every firm makes only normal profit, producing where MC=MR=AR=AC\text{MC} = \text{MR} = \text{AR} = \text{AC}MC=MR=AR=AC.
Note
- Supernormal profit is a signal that draws resources in, while losses drive resources out.
- The long-run outcome of only normal profit follows directly from free entry and exit and perfect knowledge.
Is Perfect Competition Really the Ideal?
- Perfect competition delivers low prices, productive and allocative efficiency and large consumer surplus, which is why it is used as the benchmark for judging other markets.
- But the assumptions of identical products, perfect knowledge and costless entry almost never hold, so the model is an idealisation rather than a description of most real markets.
- More competition is not always better, since firms earning only normal profit have little spare to fund research, so a monopoly or oligopoly may be more dynamically efficient over time.
- Where large economies of scale exist, many tiny price-taking firms would each produce at higher average cost than one large firm, so fragmentation can raise costs rather than lower them.
- So whether the competitive ideal is best depends on the industry, and in particular on how large economies of scale are and how far the product relies on ongoing innovation.
Exam technique
- Show the firm's demand curve as horizontal at the market price.
- State that AR=MR=price\text{AR} = \text{MR} = \text{price}AR=MR=price for the price taker.
Common Mistake
- Do not draw a downward-sloping demand curve for the individual firm.
- A perfectly competitive firm's demand curve is horizontal.
Self review
- List the assumptions of perfect competition.
- Why is the firm a price taker?
- What shape is the firm's demand curve?
- What does AR equal for the firm?
- What forms of profit or loss can a firm make in the short run, and what profit does it make in long-run equilibrium?
1.5.3b Price takers and efficient resource allocation
Competitive Firms Are Price Takers Who Accept the Market Price
Definition
Price taker: a firm that must accept the ruling market price and cannot influence it by changing its own level of output.
- In highly competitive markets there are many buyers and sellers.
- Firms are price takers, accepting the price the market sets.
- Easy entry and exit stops firms earning high profits for long.
Note
- Price takers cannot set their own price.
- Free entry competes away any lasting profit.
Many Rivals and Free Entry Keep Prices Close to Costs
- With many rivals, no firm can raise price above the market level.
- New entrants arrive whenever profits look attractive.
- This keeps prices close to costs and pushes firms to be efficient.
Example
- A market trader must match the going price or lose sales.
- High profits in a competitive market soon attract new sellers.
In Long-Run Equilibrium the Market Is Allocatively and Productively Efficient
- In long-run equilibrium price equals marginal cost, giving allocative efficiency.
- Output sits at the bottom of the average cost curve, giving productive efficiency.
- Firms earn only normal profit, so there is no supernormal profit.
Note
- Perfect competition meets both static efficiency conditions in the long run.
- This efficient allocation holds only given assumptions such as an absence of externalities.
- With profits competed away, there may be little left for research.
The Last Unit Is Worth Its Cost and No Resources Are Wasted
- Price equal to marginal cost means the last unit is worth what it costs.
- Production at minimum average cost wastes no resources.
- Free entry competes any supernormal profit away.
Example
- A competitive crop market settles where price equals marginal cost.
- Any temporary profit is competed away as new growers enter.
Only Normal Profit May Leave Little to Fund Innovation
- With only normal profit, firms have little spare to invest.
- Critics argue this limits research and development.
- So the model doubles as a benchmark for judging other structures.
Give Both Static Efficiency Conditions Together
Exam technique
- State price equals marginal cost and lowest average cost together.
- Add the dynamic efficiency doubt as evaluation.
Common Mistake
- Do not claim perfect competition is efficient on every measure.
- It is statically efficient but may lack dynamic efficiency.
Self review
- What is a price taker, and why can competitive firms not set their own price?
- Why is perfect competition allocatively efficient in the long run?
- Why is it productively efficient?
- What profit do firms earn in long-run equilibrium?
- Why might the model lack dynamic efficiency?
