3.4.5a Monopoly equilibrium
Monopoly Equilibrium
Characteristics of monopoly
Pure monopoly: a market with a single seller that supplies the whole industry output.
Price maker: a firm that can set its own price because it faces the whole downward-sloping market demand curve.
Barriers to entry: obstacles such as patents, high fixed and sunk costs or control of an essential input that keep new firms out of the market.
Monopoly power: the ability to influence the market price, present in weaker forms wherever a firm holds a large market share.
- Barriers to entry are what let a monopoly persist: a regional water company, for example, faces no rivals because the sunk cost of laying a second network of pipes is prohibitive, so its supernormal profit is not competed away and can last into the long run, unlike in competitive markets where entry erodes it.
- As the sole supplier it faces the whole market demand curve, so to sell an extra unit it must lower price; that trade-off between price and quantity is exactly what makes it a price maker rather than a price taker.
- Strong branding, advertising and product differentiation reinforce monopoly power; in UK competition law the CMA treats a market share of 25% or more as a sign of it, so power exists well before a pure single-seller monopoly.
The profit-maximising rule
Marginal revenue (MR): the change in total revenue from selling one more unit of output.
Marginal cost (MC): the change in total cost from producing one more unit of output.
Supernormal profit: profit above normal profit, earned when average revenue exceeds average cost at the chosen output.
- If MR > MC the last unit adds more to revenue than to cost, so producing it raises profit; if MR < MC it adds more to cost than to revenue, so cutting back raises profit. Profit therefore peaks exactly where MC = MR.
- At that output the monopolist charges the highest price the demand curve will bear, read up to AR. Because AR lies above MR on a downward-sloping demand curve, price exceeds MR and so exceeds MC, which is the source of the allocative inefficiency (P > MC).
- Where price (AR) exceeds average cost (AC), the firm earns supernormal profit equal to (AR − AC) × Q; barriers to entry stop new firms competing it away, so it persists in the long run.
A monopolist finds that the last unit at which marginal cost equals marginal revenue is output 100:
MC=MR MC = MR MC=MRReading the price vertically up to the AR (demand) curve gives a price of 20 per unit, while average cost at that output is 12. Supernormal profit is the rectangle (AR − AC) × Q:
Profit=(AR−AC)×Q=(20−12)×100=800 Profit = (AR - AC) \times Q = (20 - 12) \times 100 = 800 Profit=(AR−AC)×Q=(20−12)×100=800The number is the height of the profit rectangle (price minus unit cost) multiplied by the quantity sold, so it measures the supernormal profit protected by barriers to entry.
The monopoly diagram
- Put Price on the vertical axis and Quantity on the horizontal axis.
- The demand curve is the downward-sloping AR curve, with the MR curve below it and twice as steep; add the AC and MC curves, with MC cutting AC at its lowest point.
- Profit-maximising output Qm is where MC cuts MR from below; read the price vertically up to the AR curve at Pm, not off the MC = MR point.
- Supernormal profit is the rectangle bounded by Pm above and AC below, across output Qm.
Does a monopolist always earn supernormal profit?
- Usually yes, because high barriers to entry protect the firm, so its price can stay above average cost into the long run and the profit is not competed away.
- This is reinforced where demand is price-inelastic, since the firm can hold a high price without losing many sales, widening the gap between AR and AC.
- But not always: if market demand is weak so that AR lies below AC at every output, even a sole supplier makes a loss in the short run, as with a train operating company on a lightly used regional line that needs subsidy to keep running.
- On balance it depends on whether AR exceeds AC at the MC = MR output: a monopoly guarantees market power, not a guaranteed profit.
- Set output where marginal cost equals marginal revenue, then read the price up to the demand (AR) curve.
- Label Qm and Pm and shade the supernormal profit rectangle to secure the diagram marks.
- Do not set the price at the MC equals MR level; read it up to the AR (demand) curve.
- Do not confuse marginal revenue with average revenue, since price is read off AR.
- Keep price discrimination and the wider evaluation of monopoly for 3.4.5b.
- Define a pure monopoly.
- What is monopoly power?
- Where does a monopolist set output?
- How do you read the price from the diagram?
- What area shows supernormal profit?
3.4.5b Price discrimination and evaluation of monopoly
Price Discrimination and Monopoly
Third-degree price discrimination
Price discrimination: charging different prices to different consumers for the same good, for reasons not based on differences in cost.
Third-degree price discrimination: splitting consumers into separate groups (by age, time or location) and charging each group a different price.
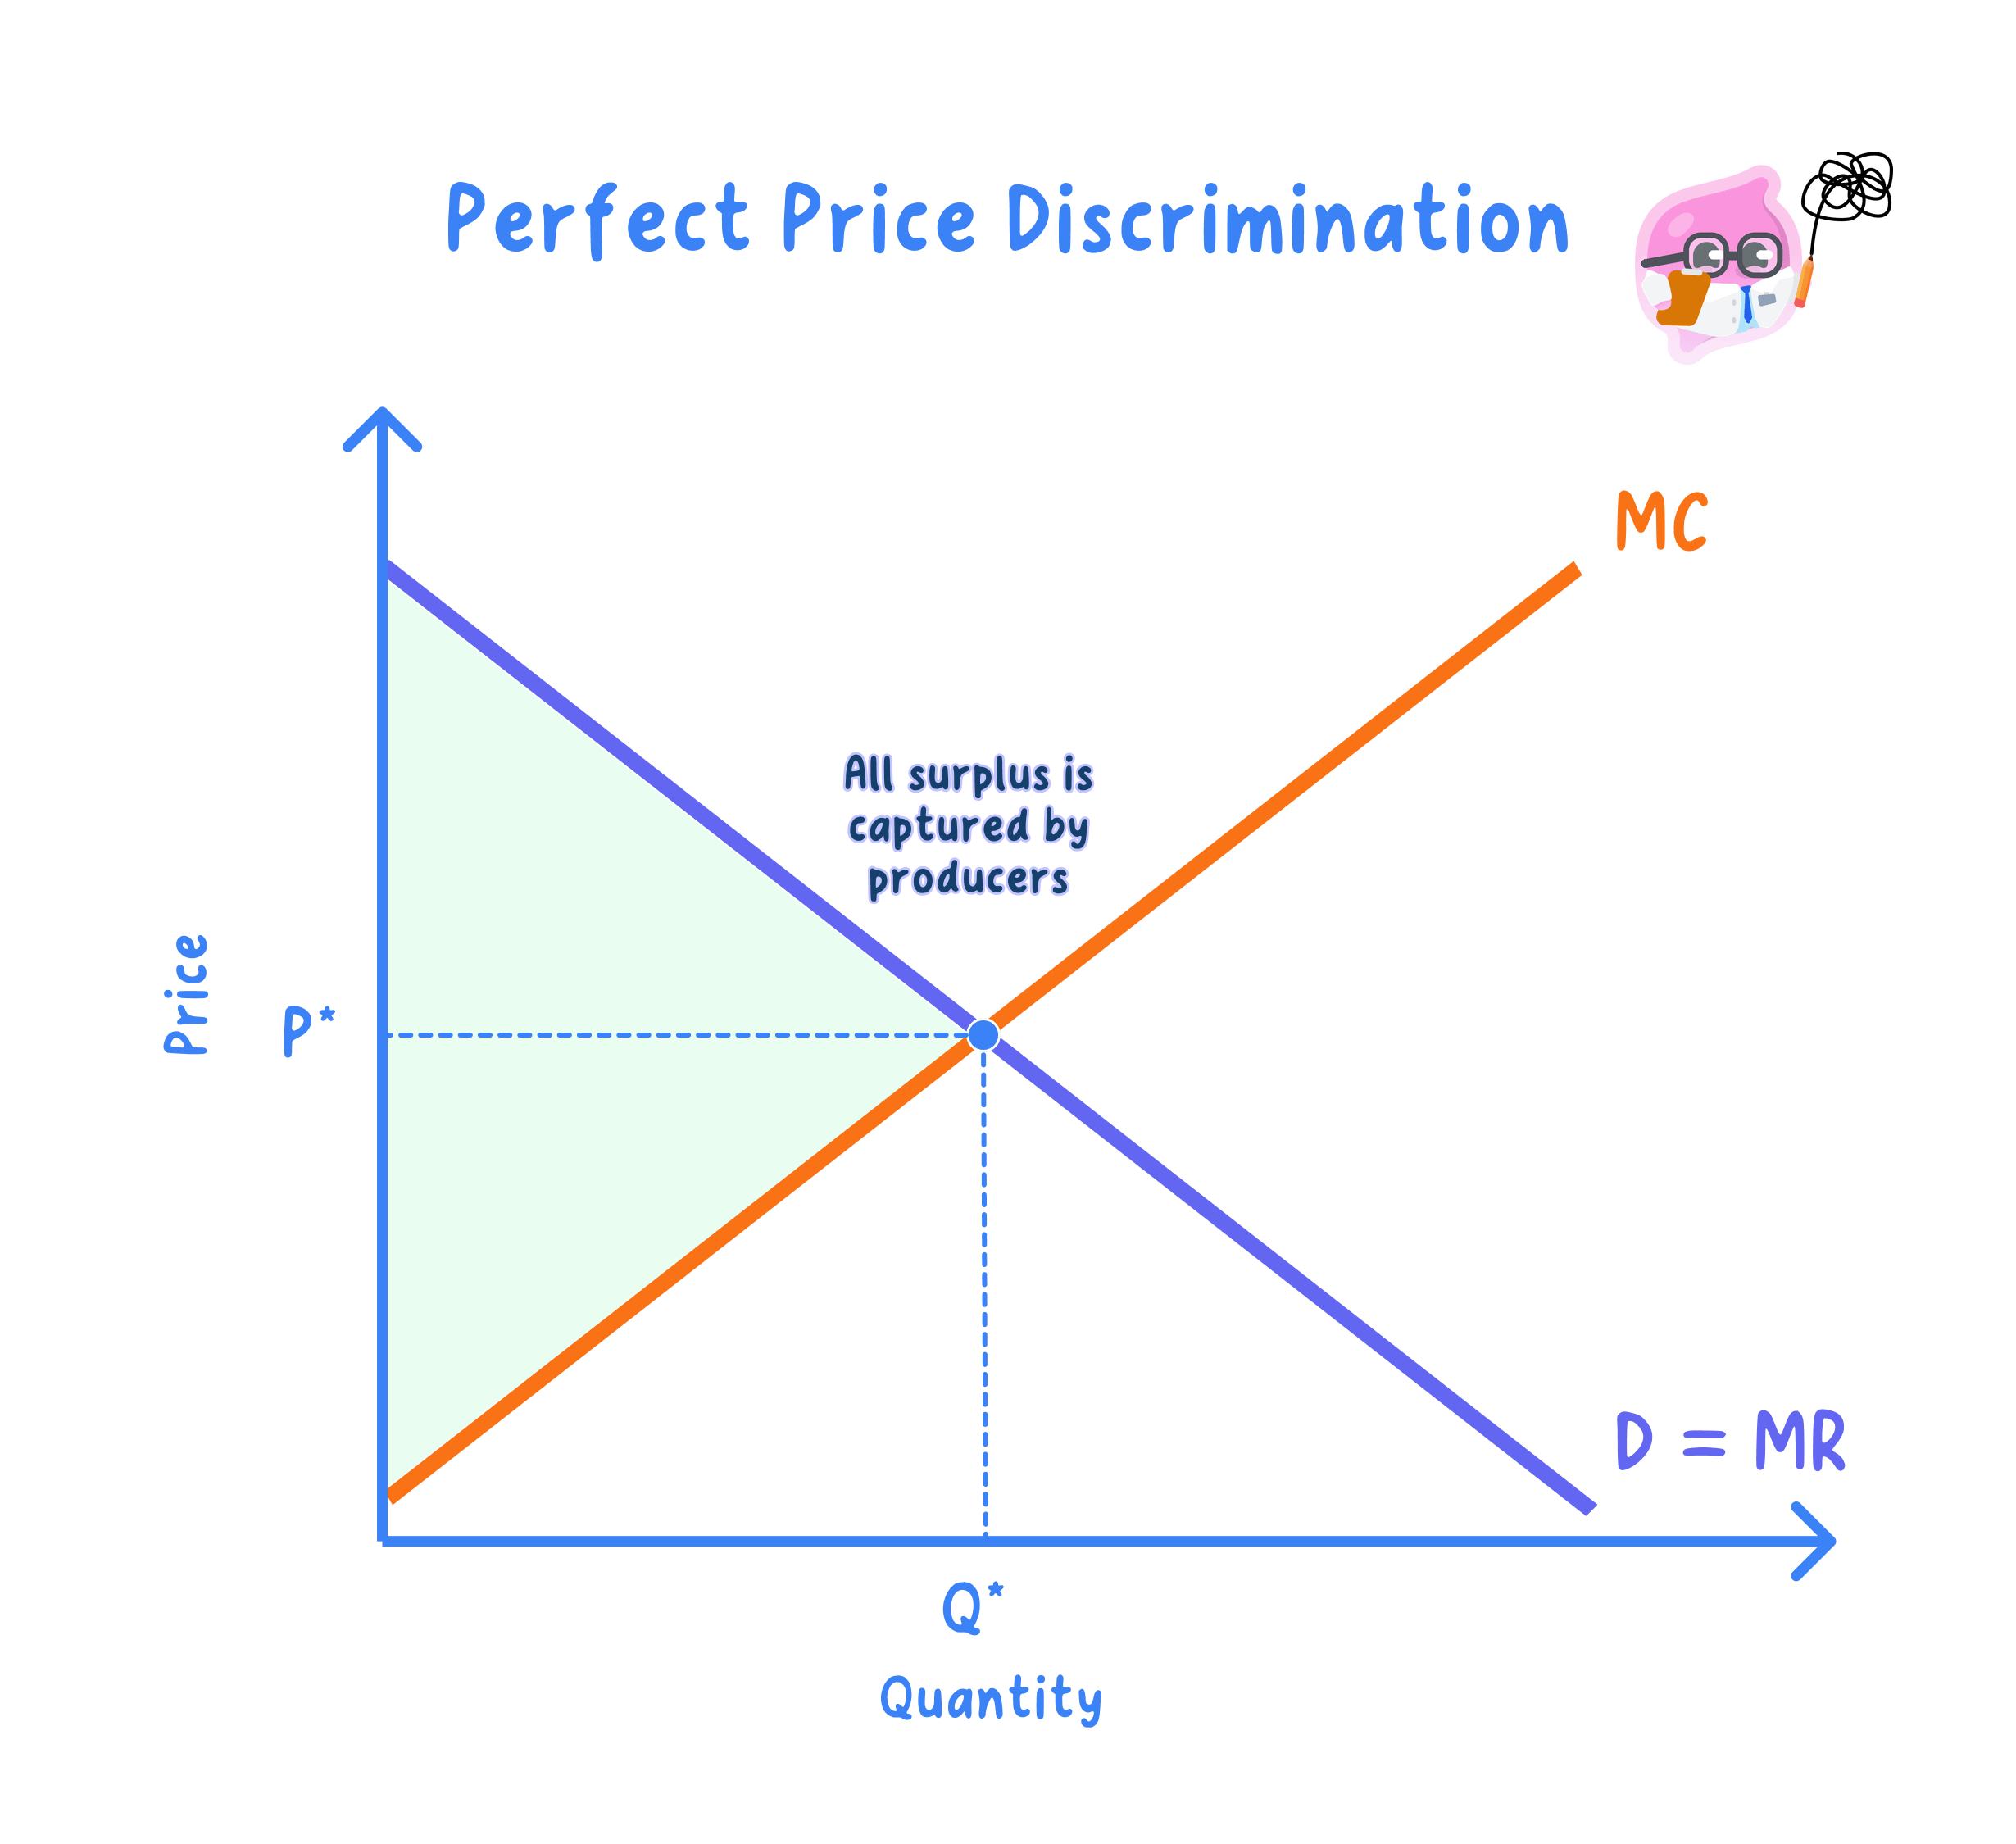
- The aim is to charge each group closer to what it is willing to pay, so the firm captures consumer surplus that a single uniform price would leave with buyers.
The three conditions and why each is needed
- Price-setting power: the firm must be a price maker facing a downward-sloping demand curve. A price taker in perfect competition could not raise price to one group without losing every sale, so without market power there is simply no room to charge different prices.
- Separable groups with different elasticities: the firm must identify groups whose price elasticity of demand differs and keep them apart. This is needed because the profit gain comes from charging the inelastic group more and the elastic group less, which only works if the groups can be told apart and cannot swap.
- No resale (no market seepage): it must stop the low-price group reselling to the high-price group. Without this, arbitrage sends the cheap units into the dear market, the two prices converge and discrimination collapses, so ticket restrictions, ID checks and timing rules exist to block it.
The price discrimination diagram
MR1=MR2=MC MR_1 = MR_2 = MC MR1=MR2=MC- Draw two sub-markets side by side, each with Price on the vertical axis and Quantity on the horizontal axis, sharing a common MC because the same firm supplies both.
- In the inelastic market the AR curve is steep, so setting output where MC = MR gives a higher price; in the elastic market the AR curve is flatter, so the same MC = MR rule gives a lower price.
- Because MR is equalised across both markets at the common MC, total profit beats the single-price outcome: the firm converts consumer surplus into producer surplus.
- A clear real case is rail and airline peak pricing: commuters and business flyers (inelastic) pay a high peak fare while leisure travellers (elastic) pay a low off-peak fare, with ticket restrictions preventing resale between them.
Costs and benefits of price discrimination
- The firm gains, converting consumer surplus into producer surplus and raising total profit above the single-price level.
- That extra profit may fund investment or cross-subsidise loss-making services, for example high peak fares helping to keep quieter routes running.
- Some consumers gain access who could not afford a single uniform price, since the elastic group (students buying discounted cinema tickets, or off-peak rail travellers) is offered a lower one.
- However, the inelastic group pays more and loses consumer surplus, so the main effect is a transfer of welfare from captive consumers to the firm.
Costs and benefits of monopoly
Deadweight welfare loss: the loss of total surplus when a monopoly restricts output below the allocatively efficient level where P = MC.
X-inefficiency: the rise in average cost that occurs when weak competitive pressure lets a firm operate wastefully.
Dynamic efficiency: improvements over time in products and processes, funded by reinvested supernormal profit.
- Consumers can face higher prices and lower output than under competition, creating a deadweight welfare loss and allocative inefficiency because P > MC.
- Weak competition can cause X-inefficiency, so productive efficiency may fall as average cost drifts up.
- But firms earn supernormal profit that can fund research and development, supporting dynamic efficiency, as with pharmaceutical firms reinvesting patent profit.
- Economies of scale can lower average cost so much that price may even fall below the competitive level, benefiting consumers.
- Employees may gain secure, well-paid jobs backed by profit, though weak competition can dull the pressure to raise wages.
- Suppliers may enjoy large, steady orders, yet a dominant buyer can squeeze the prices it pays them.
- On balance the verdict depends on economies of scale, contestability and whether the profit is reinvested in innovation rather than kept as X-inefficiency.
Natural monopoly
Natural monopoly: a market where economies of scale are so large relative to demand that one firm supplies the whole market at a lower average cost than two or more could.
- Long-run average cost keeps falling across the whole relevant range, so competition would merely duplicate huge fixed costs; it is typical of utilities and networks such as water, rail track and the national grid.
- Because MC lies below the falling AC, pricing at marginal cost (the allocatively efficient rule P = MC) would leave the firm making a loss, so an unregulated firm charges far above MC instead.
- This strengthens the case for regulation or public ownership, for example price caps set by a sector regulator such as Ofwat or Ofgem, or scrutiny by the CMA.
Is price discrimination unfair?
- It can look unfair because the inelastic group, often commuters or business travellers with few alternatives, pay more and lose consumer surplus that transfers to the firm.
- It can also entrench market power, since the extra profit strengthens an already dominant firm and may deter entry.
- But it can be fair and efficient: the elastic group gains access it could not otherwise afford, and cross-subsidy can keep socially valuable but loss-making services running.
- On balance it depends on who the groups are and how the profit is used: discrimination that widens access and funds investment is more defensible than pure surplus extraction from captive consumers.
- For price discrimination, state all three conditions: price-setting power, separable groups by elasticity and no resale.
- Draw the two sub-markets side by side, a higher price in the inelastic market and a lower price in the elastic.
- When evaluating monopoly, weigh static welfare losses against dynamic gains and reach a supported judgement.
- Do not forget the no-resale condition, or price discrimination collapses.
- Do not claim monopoly always raises price, since economies of scale can lower it below the competitive level.
- Do not assume any large firm is a natural monopoly, as it is defined by scale economies relative to demand, not size.
- What are the three conditions for price discrimination?
- Why does the inelastic group pay a higher price?
- Give two costs and two benefits of monopoly.
- How can monopoly affect employees and suppliers?
- What is a natural monopoly?
