Aggregate supply
Definition
Aggregate supply (AS): the total quantity of goods and services that producers plan to supply at each average price level.
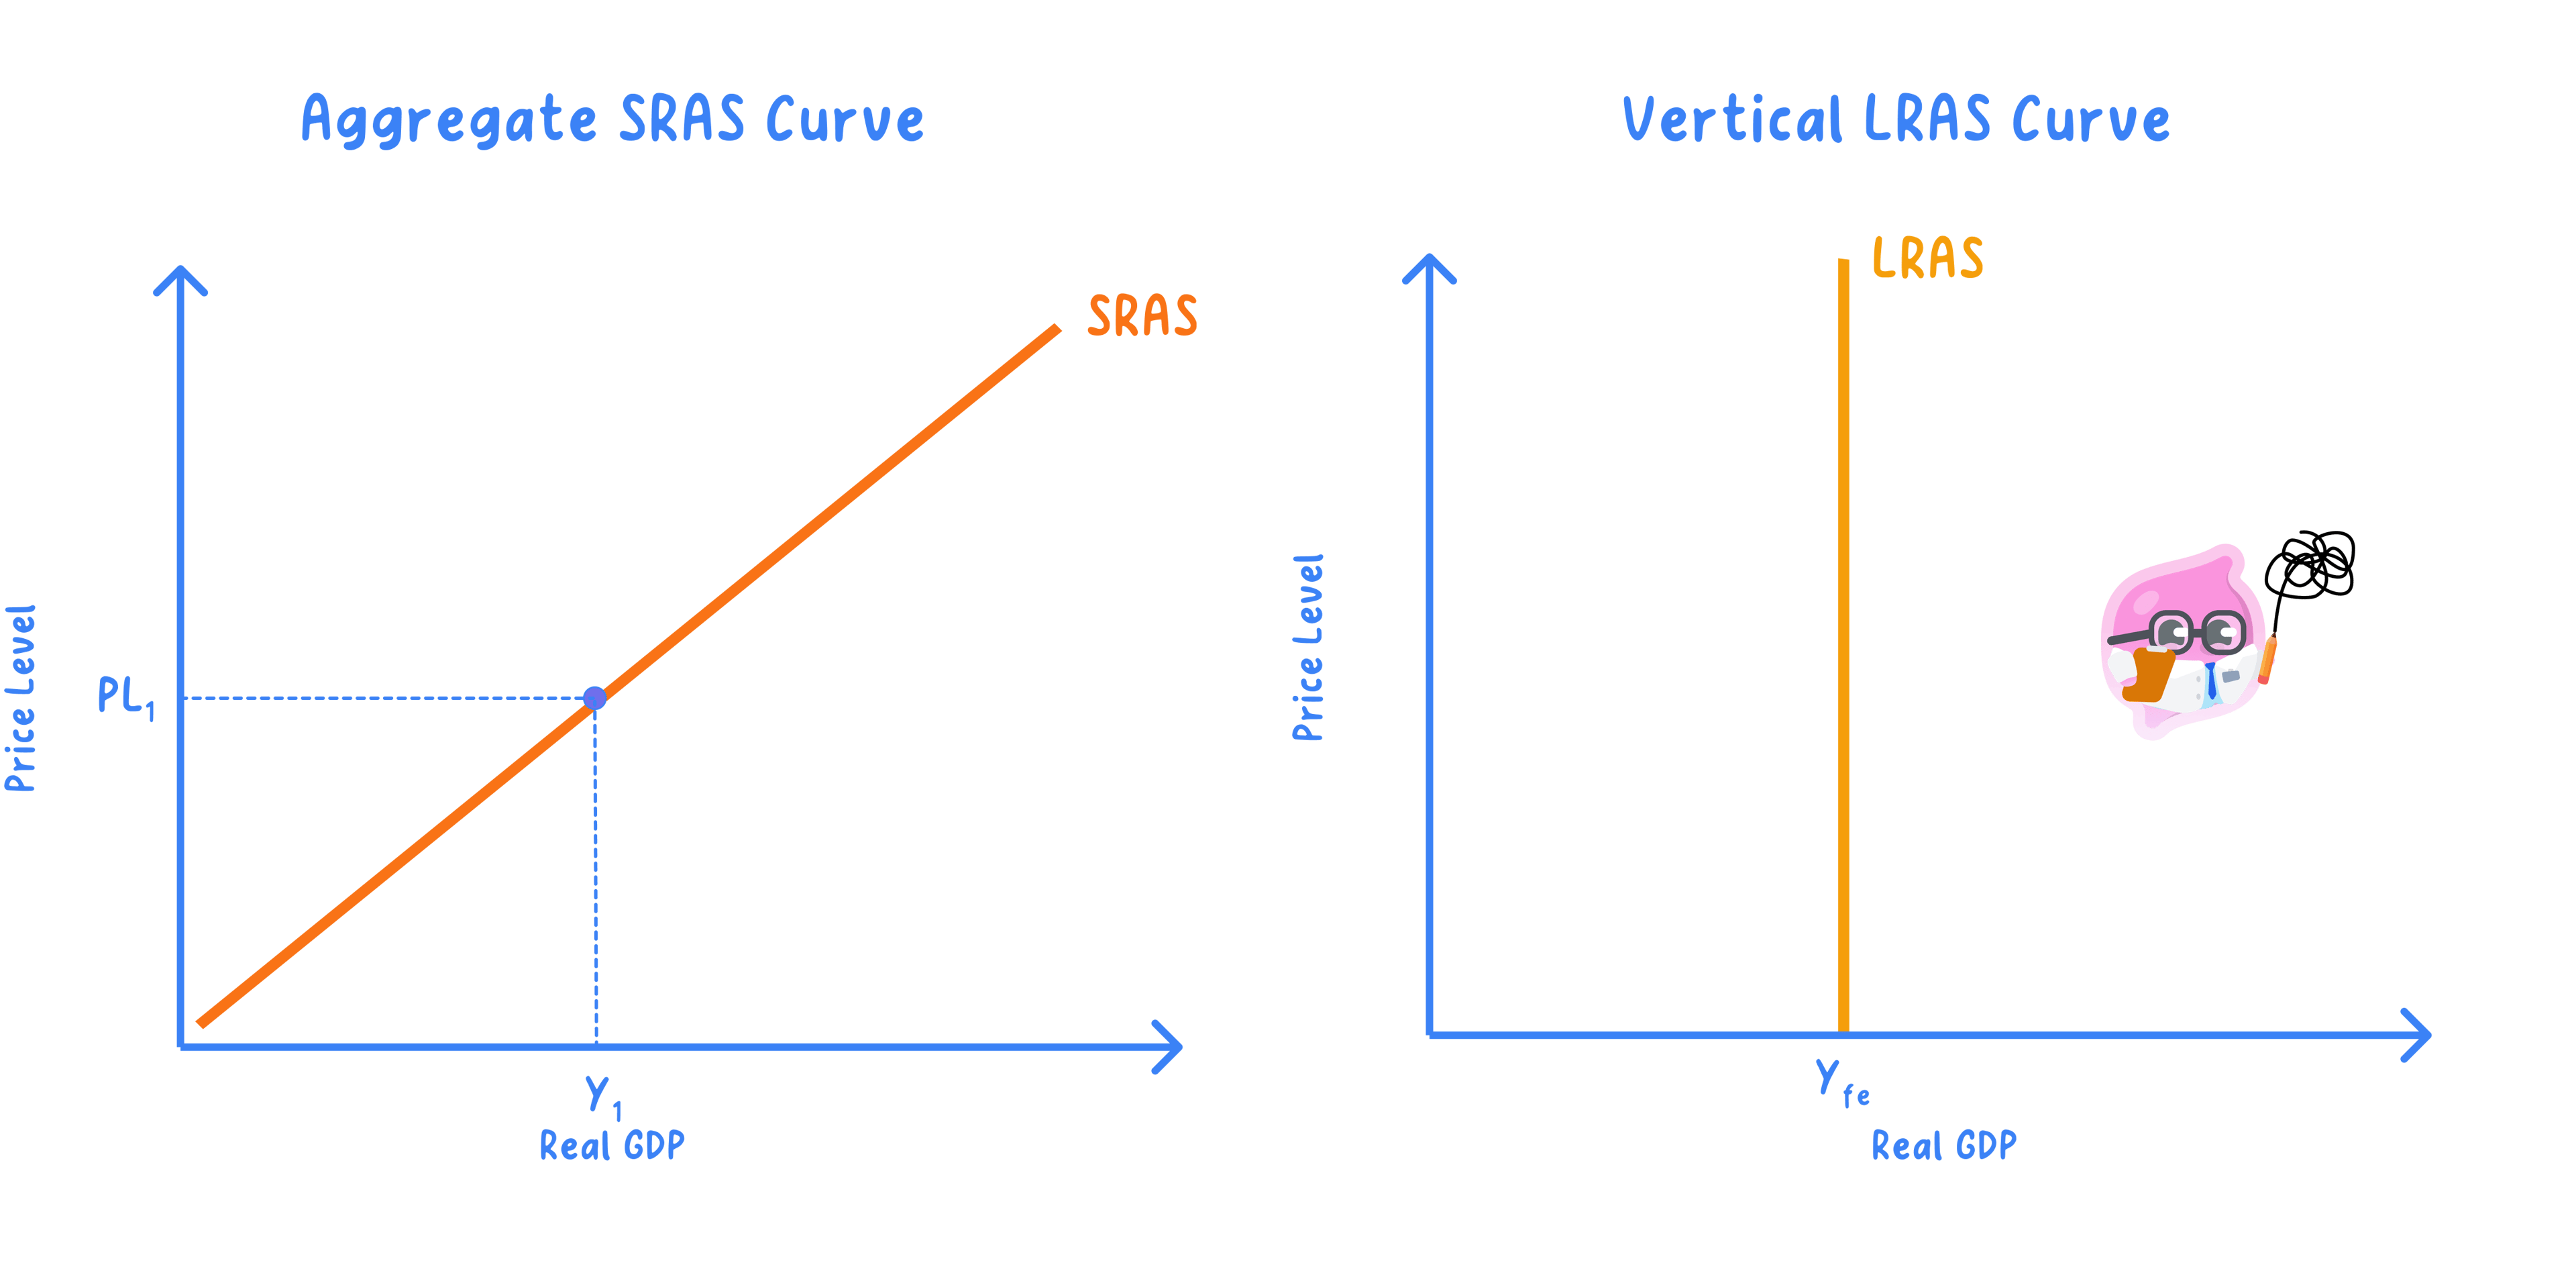
AS curve: a curve drawn with the average price level on the vertical axis and real output on the horizontal axis.
- In the short run the AS curve slopes upwards, because costs are broadly fixed, so a higher price level widens profit margins and encourages firms to supply more output.
- That upward slope means output responds to the price level only while costs are given; once costs themselves change, the whole curve shifts instead.
Movements and shifts
Definition
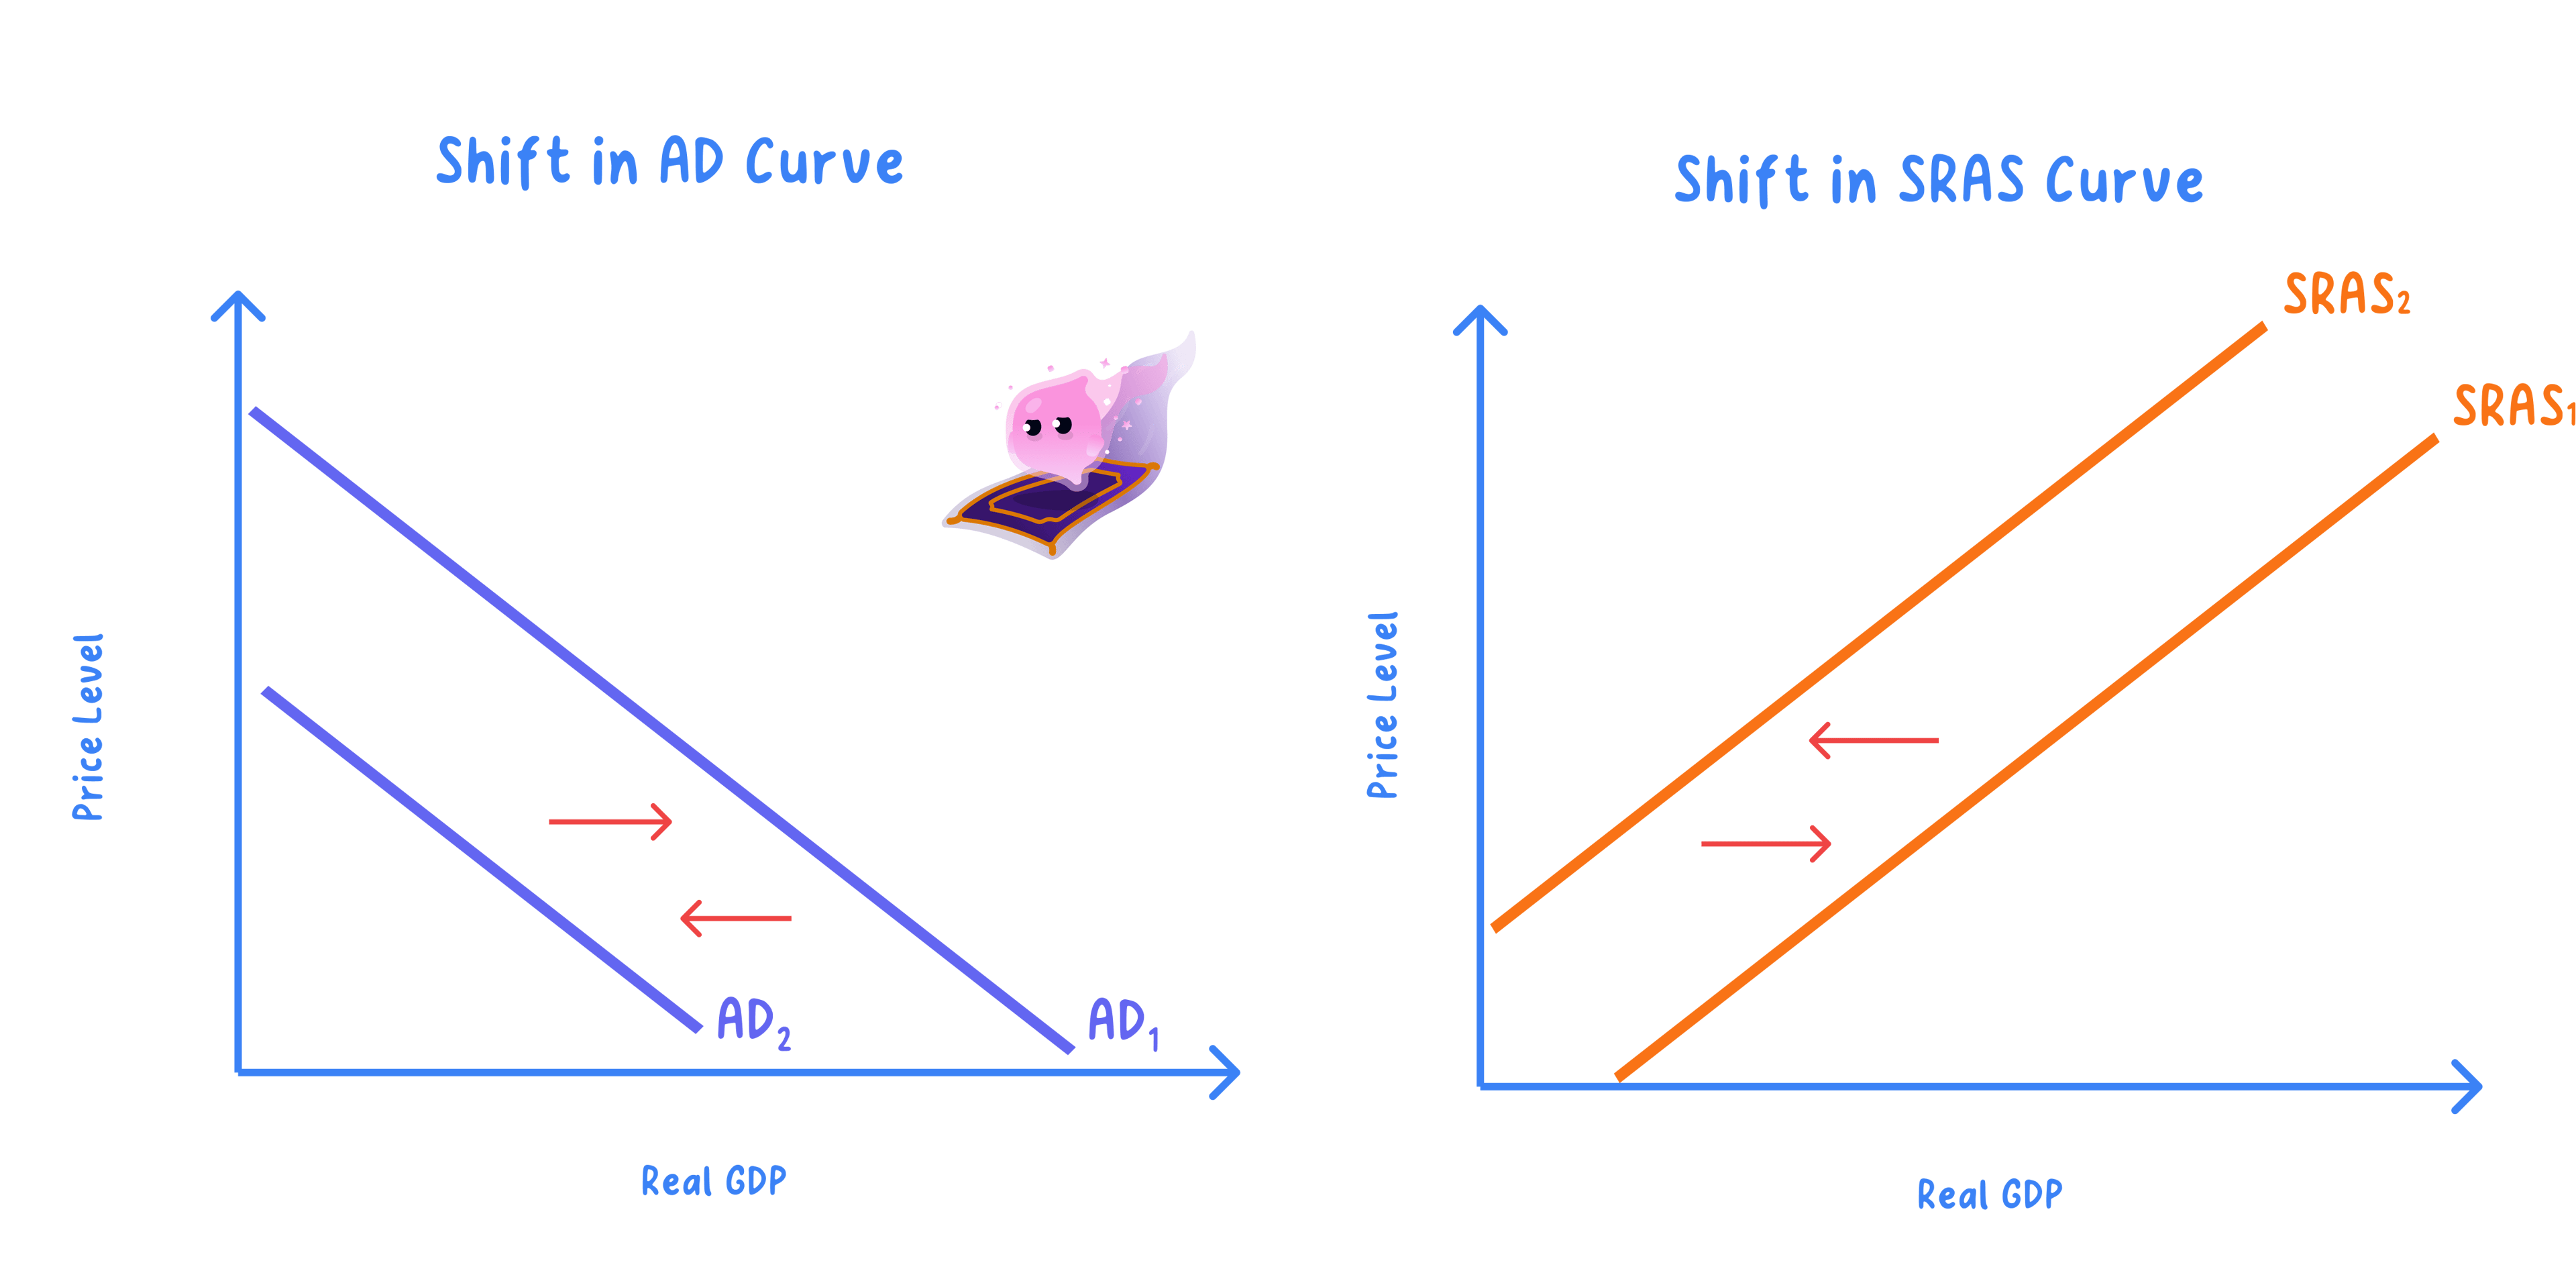
Movement along AS: a change in output supplied caused only by a change in the average price level.
Shift of AS: a change in output supplied at every price level, caused by a change in production costs or productive capacity.
- A rightward shift means more output can be supplied at every price level, and a leftward shift means less.
- Because a movement stays on the same curve while a shift redraws it, correctly identifying the cause, a price-level change versus a cost or capacity change, decides which you show.
Example
- A fall in oil prices lowers firms' costs and shifts AS to the right.
- Better technology that raises productive capacity also shifts AS to the right.
- The 2022 surge in gas prices raised firms' energy costs and shifted SRAS to the left, a classic cost-push shock.
SRAS and LRAS
Definition
Short-run aggregate supply (SRAS): shows how output responds to the price level while costs of production are given.
Long-run aggregate supply (LRAS): shows the economy's potential output, set by the quantity and quality of its resources.
- Short-run AS shifts come from changing costs, such as wages or energy, whereas long-run AS shifts come from changing capacity, such as investment, technology or the size and skill of the workforce.
- The two are linked: an SRAS shift moves output around potential, while an LRAS shift moves potential itself, so only LRAS gains raise output sustainably.
SRAS or LRAS: which matters more for output?
- It holds that SRAS matters more in the short term, because cost shocks such as the 2022 surge in energy prices move output and the price level here and now.
- But LRAS matters more in the long term, because only a rise in productive capacity lets output grow without simply raising the price level.
- On balance it depends on the time horizon: SRAS drives short-run fluctuations, while LRAS sets the ceiling on sustainable output.
Exam technique
- Make clear whether you are analysing the short run or the long run before drawing conclusions.
- Label AS axes as average price level and real output, and show shifts with arrows and a new curve.
Common Mistake
- Do not confuse a movement along AS, caused by the price level, with a shift caused by costs or capacity.
- Short-run AS shifts reflect costs, whereas long-run AS shifts reflect the economy's productive potential.
Self review
- What does the AS curve show and how are its axes labelled?
- What causes a movement along, rather than a shift of, the AS curve?
- How does short-run AS differ from long-run AS?
