1.7.1a Income, wealth, equality and equity
Income Is a Flow, Wealth Is a Stock
Definition
Income: a flow of money received over a period of time, such as wages, interest, rent and profit.
Wealth: a stock of assets held at a point in time, such as property, shares, pensions and savings.
- Income is a flow of money received over a period of time.
- It comes from wages, interest, rent, profit and transfer payments.
- Wealth is a stock of assets held at a point in time.
Note
- Income is a flow; wealth is a stock.
- Wealth is usually far more unequally distributed than income.
Income and Wealth Reinforce Each Other Over Time
- Wealth generates income, such as rent or interest.
- Income can be saved to build up wealth.
- So the two reinforce each other over time.
Example
- A monthly salary is income; a house and a pension pot are wealth.
- Savings from income can grow into a stock of wealth.
Living Standards Depend on Both Income and Wealth
- Living standards depend on both income and wealth.
- Wealth inequality is usually wider than income inequality.
- So policy must look at both when judging fairness.
Flag Income as a Flow and Wealth as a Stock
Exam technique
- Call income a flow and wealth a stock.
- Note that wealth is more unequally distributed than income.
Common Mistake
- Do not use income and wealth interchangeably.
- Income is a flow over time; wealth is a stock at a point in time.
Worked Example: Turning Income Into Wealth
- A worker earns a monthly income of £2,500\pounds 2{,}500£2,500, a flow received each month.
- Saving 20%20\%20% of this income each month sets aside £500\pounds 500£500 as a monthly flow of savings.
- £500\pounds 500£500 saved every month for 363636 months (333 years) accumulates to £500×36=£18,000\pounds 500 \times 36 = \pounds 18{,}000£500×36=£18,000, with no interest included.
Example
- The £18,000\pounds 18{,}000£18,000 is now a stock of wealth held at a point in time, built up from a flow of income.
- If this stock were invested at interest rather than left idle, it would grow further and start generating its own income, showing how wealth and income reinforce each other.
Equality Means Sameness, Equity Means Fairness
- Equality is an even, identical distribution of income or wealth.
- Equity is a fair or just distribution, which is a normative judgement.
- An equal distribution is not necessarily an equitable one.
Note
- Equality is about sameness; equity is about fairness.
- What counts as fair rests on value judgements, so economists disagree.
Equity Can Be Horizontal or Vertical
- Horizontal equity treats those in the same circumstances the same way.
- Vertical equity treats those in different circumstances differently.
- For example, vertical equity supports taxing higher earners more.
Example
- Two people on the same income paying the same tax is horizontal equity.
- A higher earner paying a higher tax rate reflects vertical equity.
A Perfectly Equal Distribution Can Still Seem Unfair
- A perfectly equal split may still strike people as unfair.
- Judging fairness means making a value judgement.
- So economists can agree on the facts yet differ on what is equitable.
Separate Fairness From Sameness in Your Answer
Exam technique
- Define equality as sameness and equity as fairness.
- Use horizontal and vertical equity to show fairness is a judgement.
Common Mistake
- Do not treat equality and equity as the same idea.
- An equal distribution is not necessarily an equitable one.
Pay, Assets and Inheritance Drive Income and Wealth Inequality
- Income and wealth inequality has several linked causes.
- Differences in skills, education and productivity feed wage differentials.
- Ownership of assets and inheritance widen the gap further.
Note
- Unequal pay reflects skills, productivity and market demand.
- Unequal wealth reflects asset ownership and inheritance.
Unemployment, Discrimination and Policy Also Shape the Gap
- Unemployment and discrimination push some groups towards the bottom.
- The tax and benefit system can narrow or widen the gap.
- Inequality also varies between regions and between countries.
Example
- A family inheriting property starts far ahead of one starting with nothing.
- A region with declining industry can fall behind a booming city.
UK Application: Measuring How Unequal Income and Wealth Are
- The Office for National Statistics estimates the UK income Gini coefficient at around 0.350.350.35, where 000 is perfect equality and 111 is perfect inequality.
- The UK wealth Gini coefficient is much higher, at around 0.630.630.63, confirming that wealth is far more unequally distributed than income.
- The National Living Wage and Universal Credit both aim to raise incomes at the bottom of the distribution.
- HMRC's progressive income tax system, with higher marginal rates on higher earnings, is designed to narrow post-tax income inequality.
Case study
- A full-time worker on the National Living Wage sees their gross pay rise each April, directly raising their income.
- Universal Credit tops up the income of low-paid or unemployed households, narrowing the gap at the bottom of the distribution.
Some Inequality Gives Incentives, but Extremes Are Self-Reinforcing
- Some inequality rewards effort and gives incentives to work and invest.
- But extreme inequality can be self-reinforcing through inherited wealth.
- So the causes shape both fairness and the economy's long-run health.
Separate Income Causes From Wealth Causes
Exam technique
- Group causes into pay-based, asset-based and policy-based factors.
- Apply them both within a country and between countries.
Common Mistake
- Do not treat inequality as simply the result of differences in effort.
- Asset ownership and inheritance matter as much as skills and pay.
Evaluate the Trade-off Between Equity and Efficiency
- Reducing inequality through taxes and benefits can improve social cohesion and raise aggregate demand, since lower-income households have a higher marginal propensity to consume.
- However, higher taxes on income and wealth may reduce the incentive to work, save or invest, potentially slowing economic growth.
- This equity-efficiency trade-off means redistributing income can shrink the total size of the economic pie even as it is shared more evenly.
Hint
- Economist Arthur Okun described this as carrying money in a leaky bucket: some is lost in transit from rich to poor through administrative costs and reduced incentives.
- A good evaluative answer weighs the equity gains from redistribution against the possible efficiency costs, rather than assuming one always dominates.
Self review
- Define income and wealth, and say which is a flow and which is a stock.
- How are income and wealth linked?
- Distinguish equality from equity, and horizontal from vertical equity.
- Name three factors that influence the distribution of income and wealth.
- Why is wealth usually more unequally distributed than income?
- Explain, using the leaky bucket idea, why redistributing income might involve a trade-off between equity and efficiency.
1.7.1b Measuring and evaluating distribution
The Lorenz Curve and Gini Coefficient Measure Inequality
Definition
Gini coefficient: a numerical measure of income or wealth inequality derived from the Lorenz curve, ranging from 000 (perfect equality) to 111 (perfect inequality).
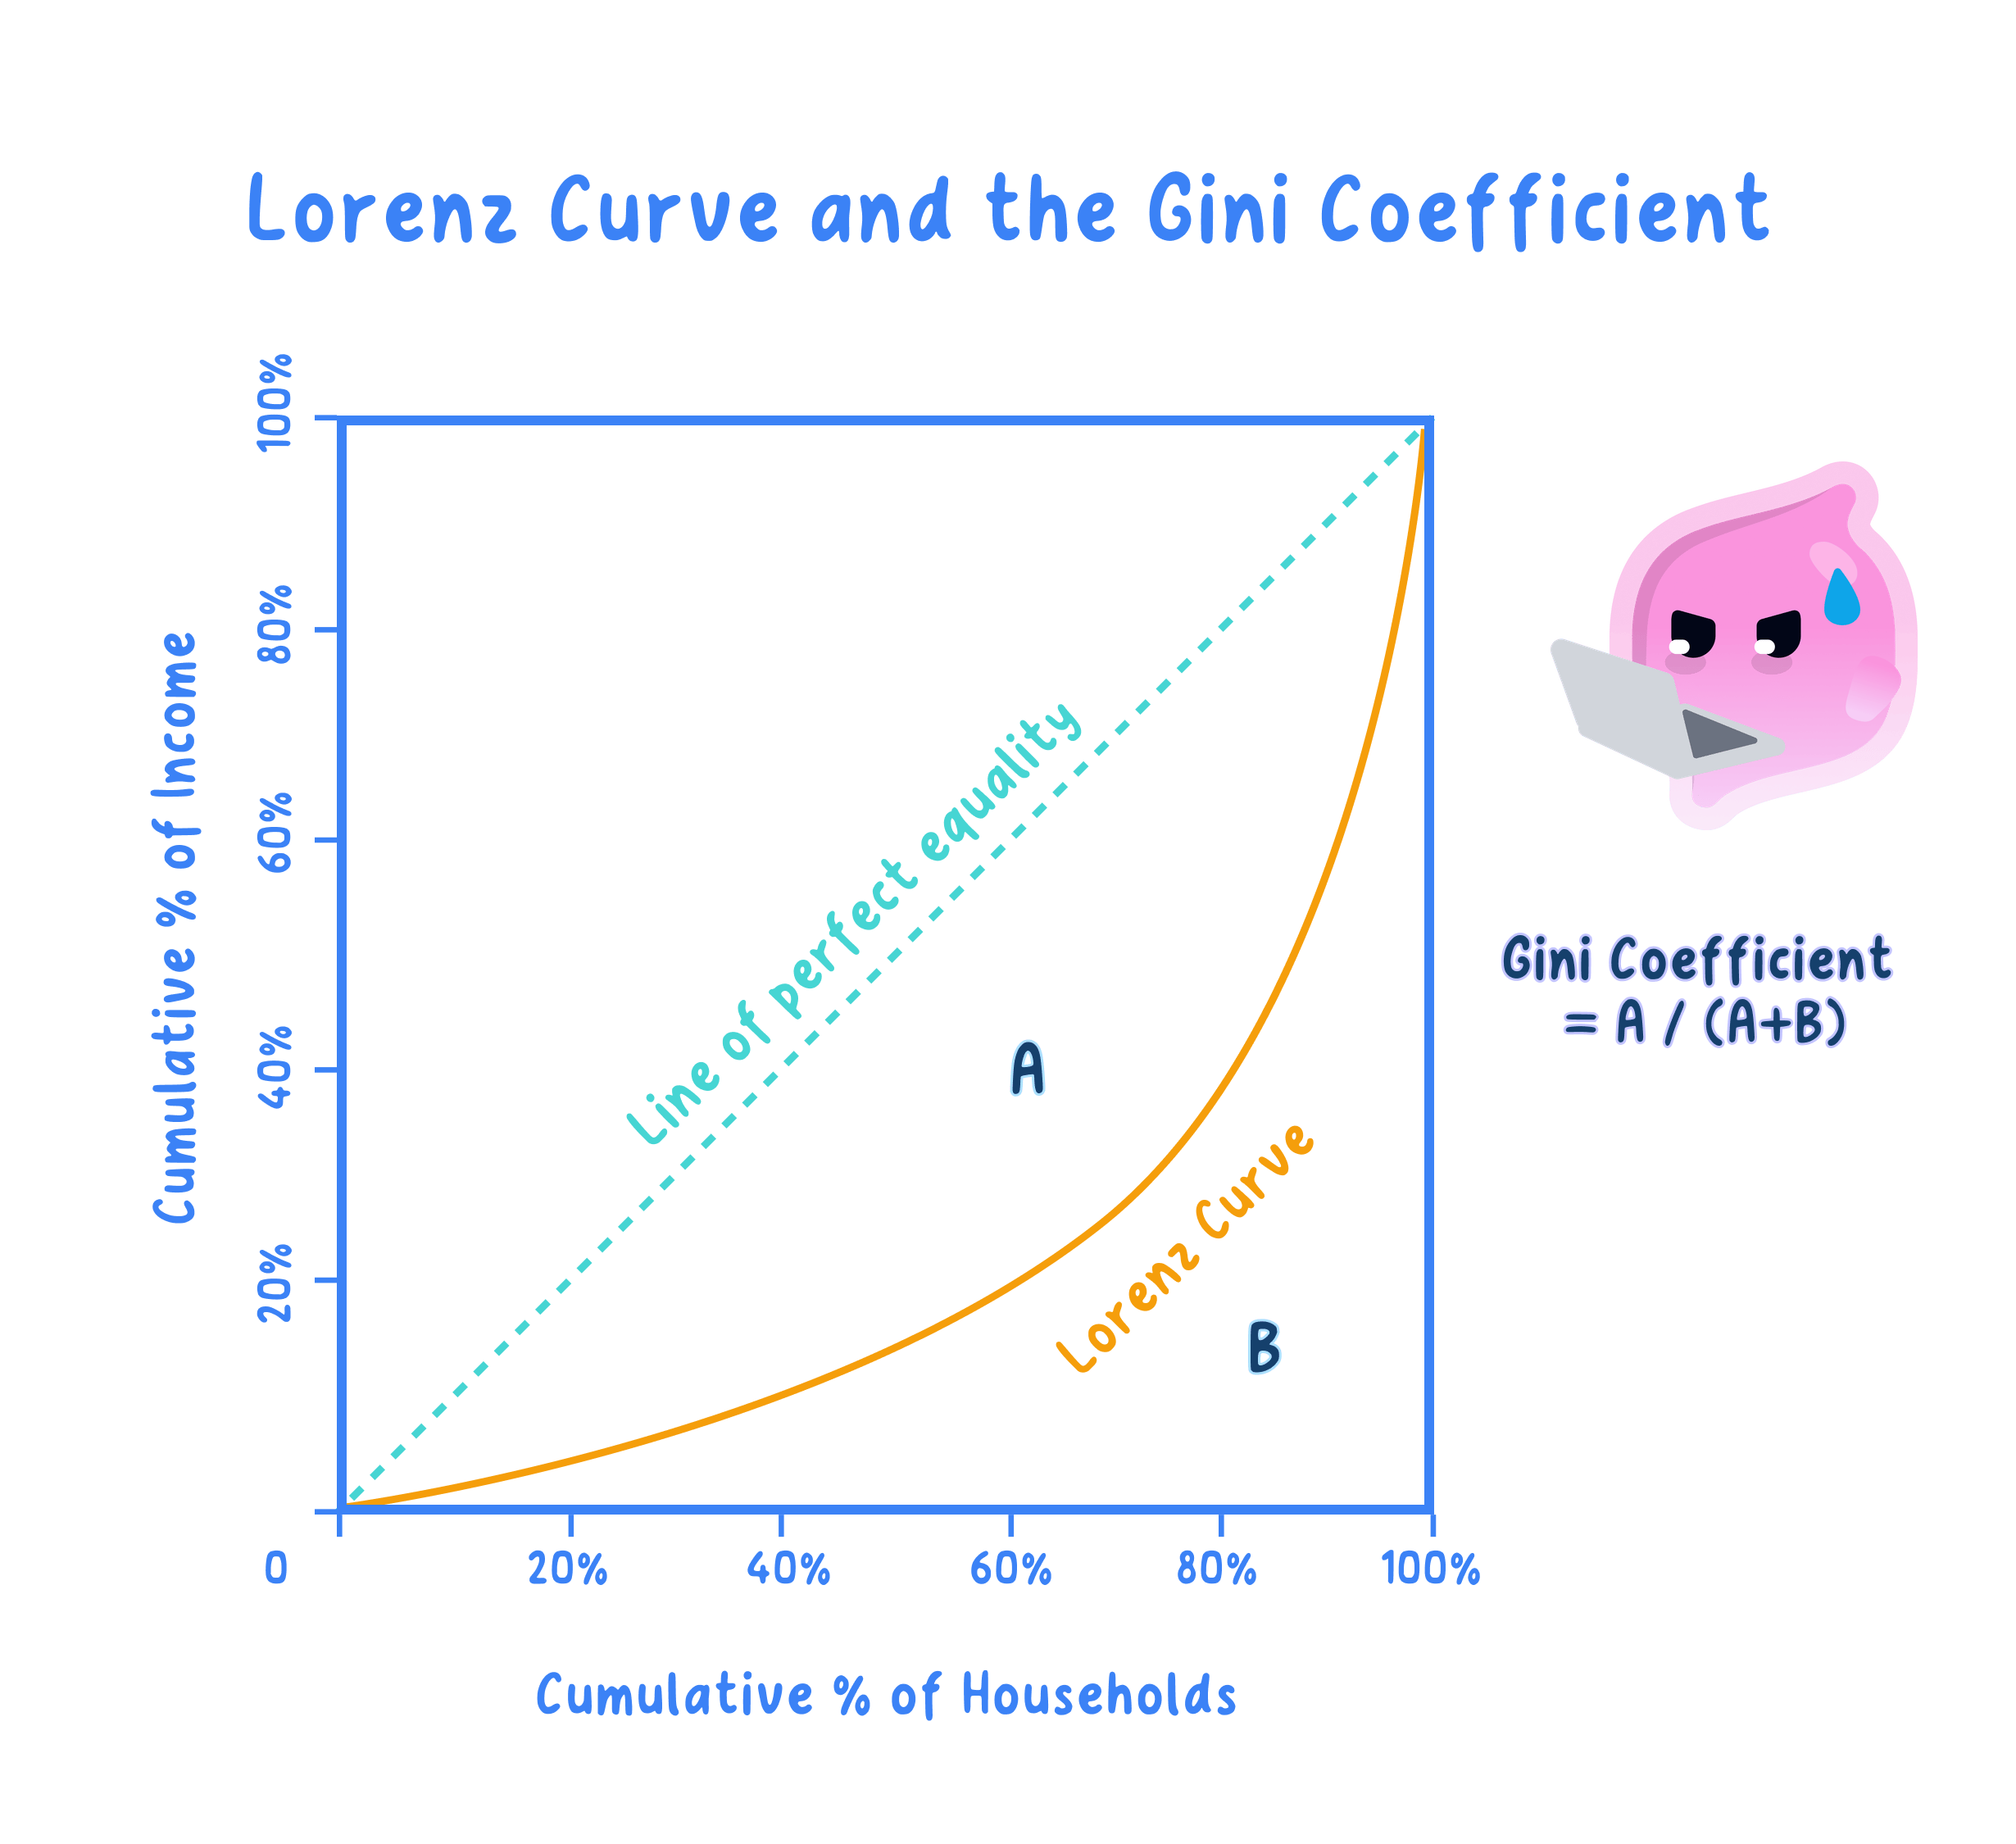
- The Lorenz curve plots the cumulative share of income against the cumulative share of the population.
- The diagonal line of perfect equality is the benchmark.
- The further the curve bows away from the diagonal, the greater the inequality.
Note
- A curve on the diagonal means everyone has an equal share.
- A curve bowed further from it shows greater inequality.
The Gini Coefficient Runs From 000 for Perfect Equality to 111 for Perfect Inequality
- The Gini coefficient is the area between the Lorenz curve and the line of equality, over the total area beneath the line.
- It runs from 000 for perfect equality to 111 for perfect inequality.
- You interpret and compare Gini values; calculating it is generally not required.
- One limitation is that the Gini reduces the whole distribution to a single number, so it can hide where in the distribution the inequality lies.
Example
- A country with a curve near the diagonal has a low Gini and low inequality.
- A country with a deeply bowed curve has a higher Gini.
A Curve Nearer the Diagonal Shows a More Equal Distribution
- A curve nearer the diagonal shows a more equal distribution.
- A curve further out shows a less equal one.
- So two curves let you rank countries or years by inequality.
Read Inequality From the Bow of the Curve
Exam technique
- Label the axes cumulative share of population and of income.
- Say a bigger gap from the diagonal means more inequality.
Common Mistake
- Do not read a curve closer to the diagonal as more unequal.
- Closer to the diagonal means more equal, not less.
Worked Example: Reading the Lorenz Curve and Gini Coefficient
- On the diagram, the horizontal axis shows the cumulative % of the population, ranked from the poorest to the richest, and the vertical axis shows the cumulative % of income.
- The 454545-degree diagonal is the line of perfect equality, where any given % of the population always earns that same % of income, for example the poorest 40%40\%40% earning exactly 40%40\%40% of income.
- The actual Lorenz curve bows below this diagonal, because in practice the poorest groups always hold a smaller share of income than their share of the population.
- The Gini coefficient equals the area between the Lorenz curve and the line of equality, divided by the total area under the line of equality, giving a value between 000 and 111.
Example
- Suppose the data show that the poorest 20%20\%20% of the population earn just 8%8\%8% of total income.
- On the diagram, this point sits at (20,8)(20, 8)(20,8), well below the point (20,20)(20, 20)(20,20) on the line of equality, so the Lorenz curve bows noticeably away from the diagonal at this point.
- The bigger the gap between a group's % of the population and its % of income, the further the curve bows out and the higher the resulting Gini coefficient.
- For comparison, the UK's income Gini coefficient is around 0.350.350.35, meaning its Lorenz curve bows moderately away from the diagonal, between the near-flat curve of a highly equal economy and the deeply bowed curve of a highly unequal one.
Both More Equal and More Unequal Distributions Bring Gains and Losses
- There are gains and losses from moving towards a more equal or more unequal distribution.
- The case for equality rests partly on the diminishing marginal utility of income.
- The case for tolerating inequality rests on incentives.
Note
- A pound is worth more to a poor person than to a rich one.
- But rewards for effort and risk can drive growth.
Greater Equality Can Raise Welfare, Cut Poverty and Support Demand
- Diminishing marginal utility means redistribution can raise total welfare.
- Less poverty and social tension can follow.
- Lower earners spend more of their income, supporting demand.
Example
- An extra £50\pounds 50£50 means far more to a low earner than to a millionaire.
- Higher spending by poorer households supports high-street demand.
The Right Degree of Inequality Is a Trade-off, Not a Fixed Answer
- For equality: higher welfare, less poverty and stronger demand.
- For tolerating inequality: incentives to work, save, take risks and innovate.
- Those incentives can raise growth that lifts everyone over time.
- On balance, some inequality supports incentives and growth, but beyond a point it lowers welfare, so the right degree is a trade-off, not a fixed answer.
Build a Two-Sided Judgement on the Equity and Efficiency Trade-off
Exam technique
- Give arguments for equality and for tolerating inequality.
- Link the trade-off to the wider equity and efficiency debate.
Common Mistake
- Do not assert one side without weighing the trade-off.
- A strong answer balances welfare gains against incentive effects.
Inequality Reaches Individuals, Firms and the Whole Economy
- For individuals, the chance of higher pay can sharpen effort and enterprise.
- For firms, very low incomes can mean low productivity and weak demand.
- For the economy, wide gaps can strain social cohesion and long-run growth.
Example
- The hope of higher pay can encourage a worker to train and take risks.
- Very low incomes can leave workers poorly nourished and less productive.
Self review
- What does the Lorenz curve plot, and what does the diagonal represent?
- Does a curve nearer the diagonal mean more or less inequality?
- Give one limitation of the Gini coefficient.
- Why can greater equality raise total welfare?
- Why is the right degree of inequality a trade-off?
- How can inequality affect individuals, firms and the economy?
- If the poorest 20%20\%20% of a population earn only 8%8\%8% of income, describe where this point lies relative to the line of equality.
