Demand and Supply Set the Competitive Wage
Definition
Competitive labour market: a labour market with many firms and many workers, none of whom can influence the wage, so each firm is a wage taker facing a perfectly elastic supply of labour at the market wage.
- In a competitive labour market, the wage is set where demand meets supply.
- Market forces drive the wage towards this equilibrium.
- Equilibrium fixes both the wage and the level of employment.
Note
- The market wage is set by demand for and supply of labour.
- Each firm is a wage taker facing a perfectly elastic supply at that wage.
Surpluses and Shortages Push the Wage to Equilibrium
- If the wage is above equilibrium, a surplus of labour pushes it down.
- If it is below, a shortage of workers pushes it up.
- At equilibrium the quantity of labour supplied equals that demanded.
Example
- Many cafes hire baristas at the going market wage.
- A single cafe cannot pay less, or workers move to a rival.
Shifts in Demand or Supply Move the Wage and Employment
- A rise in labour demand raises both the wage and employment.
- A rise in labour supply lowers the wage but raises employment.
- So shifts in either curve move the market to a new equilibrium.
Label the Axes Correctly
Exam technique
- Draw demand and supply with wage rate against quantity of labour.
- Show a shift moving the market to a new wage and employment level.
Common Mistake
- Do not leave the axes unlabelled.
- Use wage rate on the vertical axis and quantity of labour on the horizontal.
Describing the Competitive Labour Market Diagram
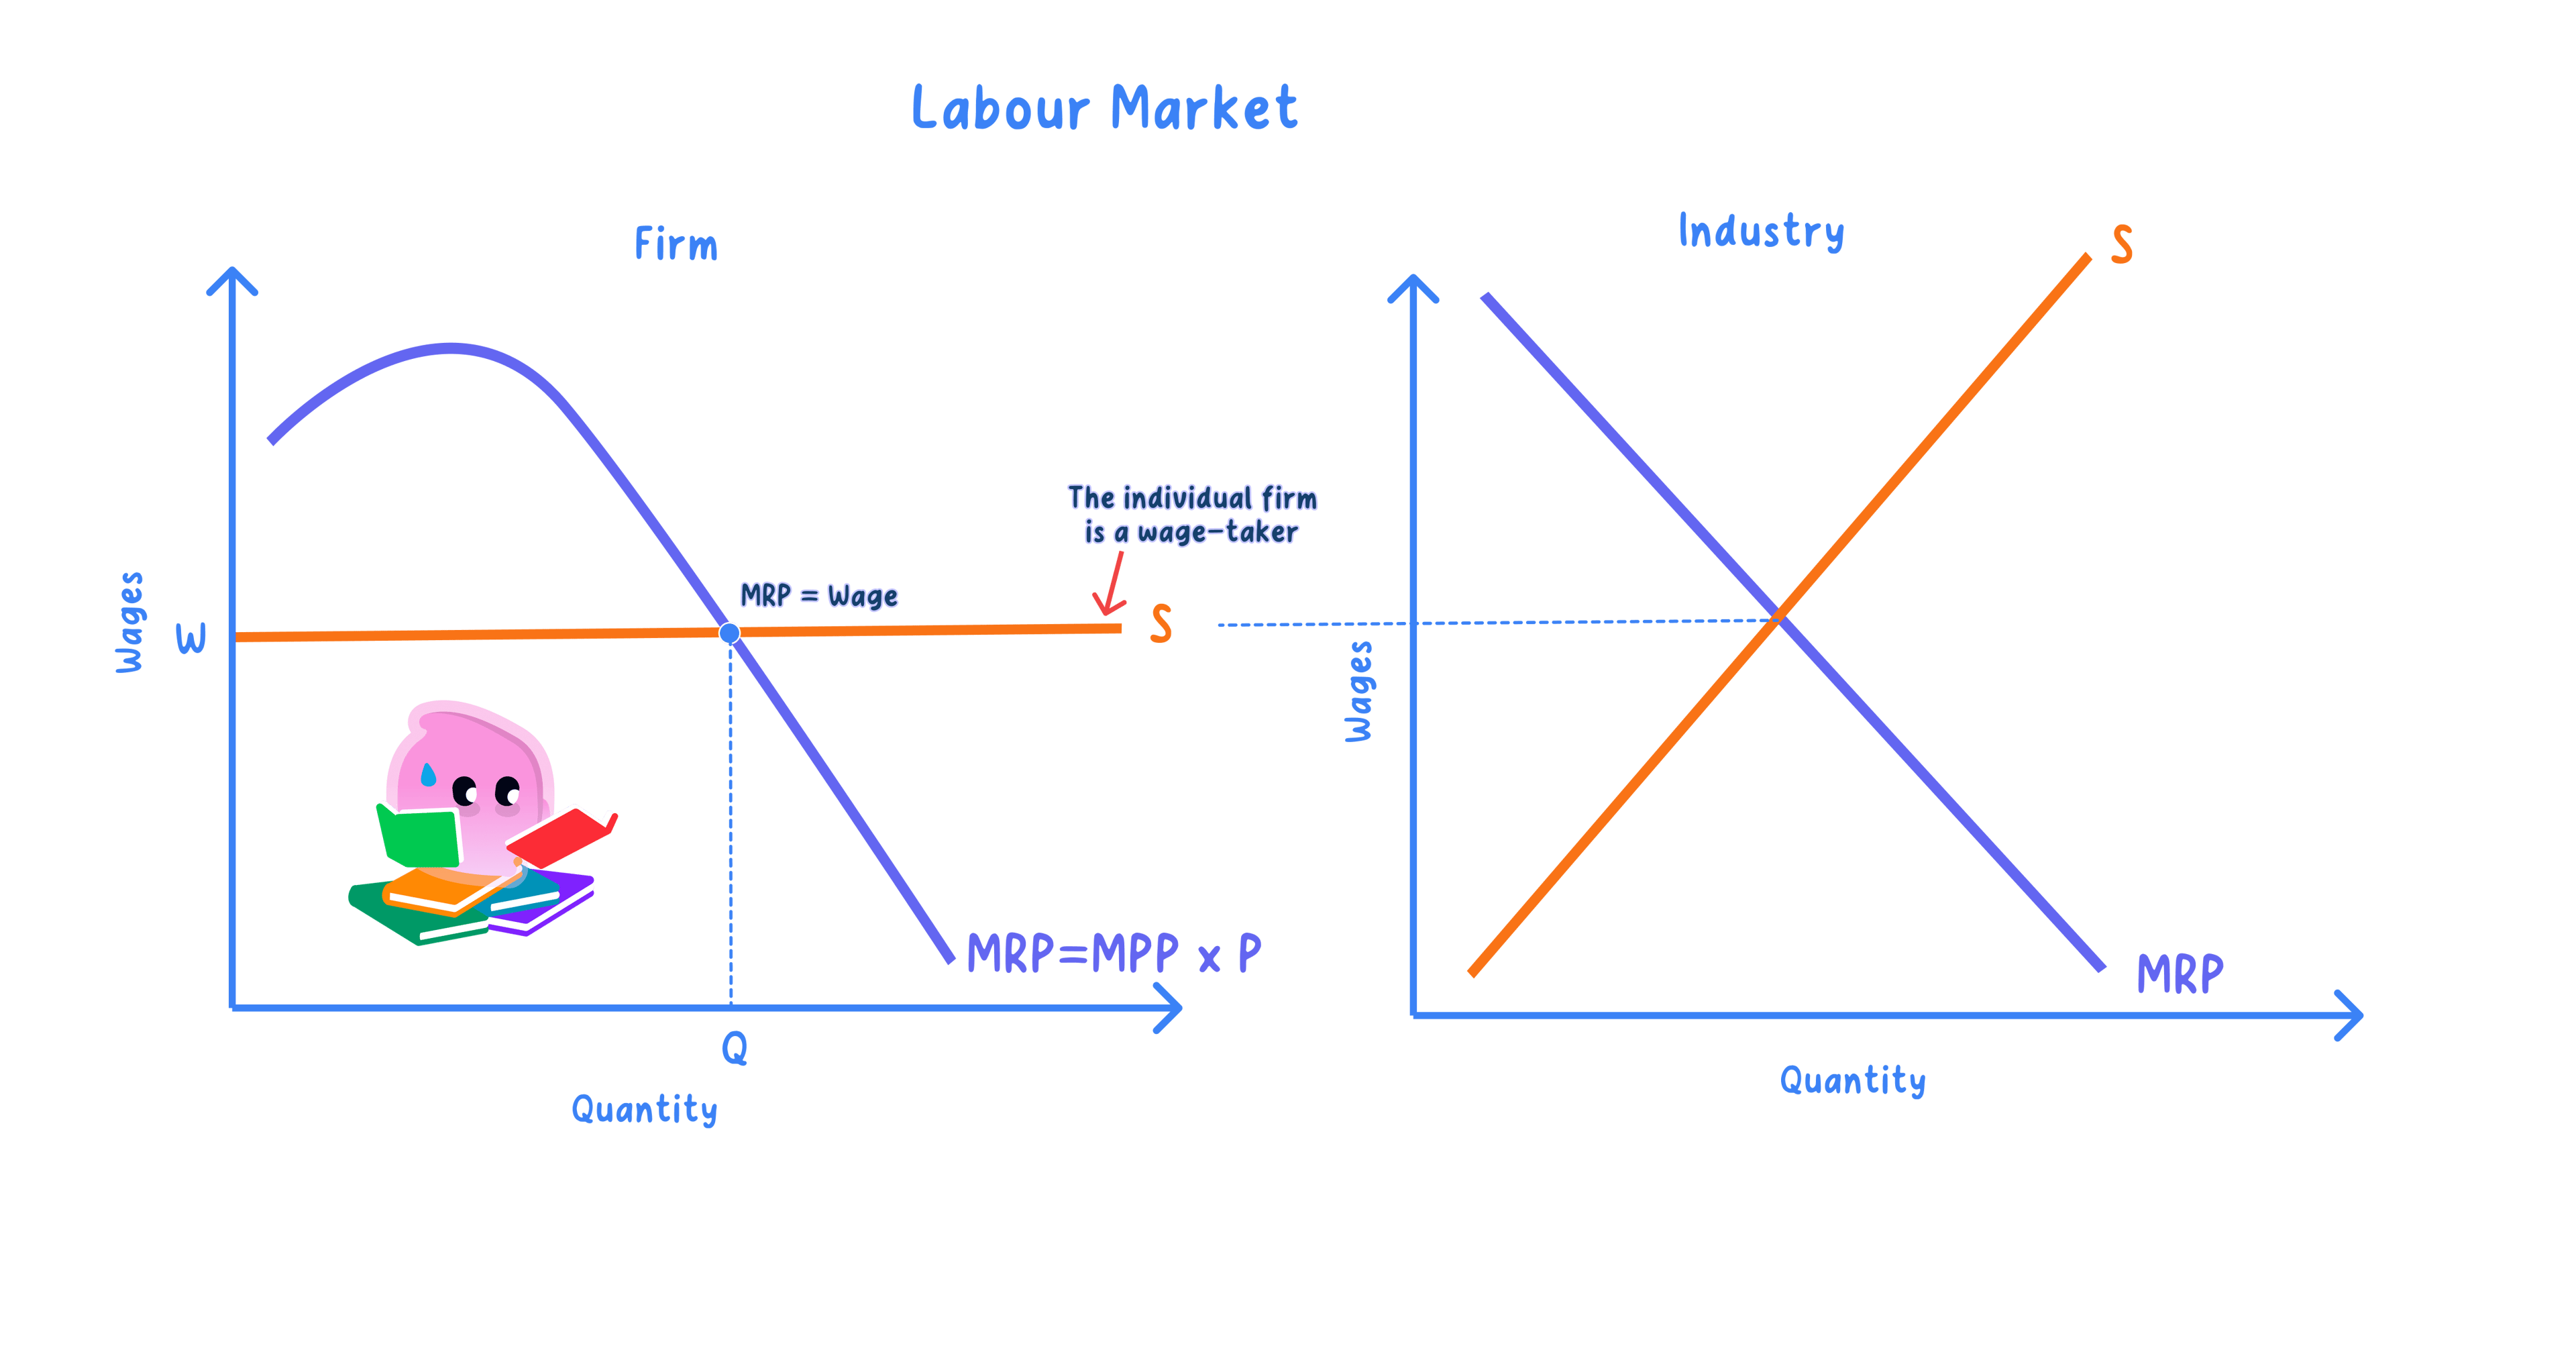
- Draw two panels side by side: the whole market on the left, a single firm on the right, both with wage rate (W) on the vertical axis and quantity of labour (QL) on the horizontal axis.
- In the market panel, the downward-sloping demand curve (D) and upward-sloping supply curve (S) intersect to fix the equilibrium wage We and total employment Qe.
- In the firm panel, the individual firm faces a perfectly elastic (horizontal) supply curve at We, since it is a wage taker and can hire as many workers as it wants at that wage.
- The firm hires up to where this horizontal supply (= its marginal cost of labour, MCL) crosses its downward-sloping marginal revenue product (MRP) curve, which fixes the firm's own employment level.
Worked Example: Calculating a Wage Differential
- A hospital consultant earns £100,000\pounds 100{,}000£100,000 a year; a hospital cleaner earns £20,000\pounds 20{,}000£20,000 a year.
- The absolute wage differential is £100,000−£20,000\pounds 100{,}000 - \pounds 20{,}000£100,000−£20,000, i.e. £80,000\pounds 80{,}000£80,000.
- As a ratio, the consultant earns £100,000÷£20,000=\pounds 100{,}000 \div \pounds 20{,}000 =£100,000÷£20,000= 555 times the cleaner's wage.
Example
- On the demand side, the consultant has a very high MRP (skilled diagnosis and treatment save lives and free capacity), while the cleaner's MRP is much lower.
- On the supply side, the consultant's supply is highly inelastic (over a decade of medical training and licensing restricts entry), while the cleaner's supply is elastic and abundant, needing little training.
- High demand meeting restricted supply, not either force alone, explains why the differential is so large.
Why Wages Differ Between Jobs
- Wage differentials are the pay gaps between occupations, industries, regions and groups.
- They arise from the interaction of labour demand and supply.
- Pay is high where demand is strong and supply is restricted.
Note
- High productivity and valuable output raise labour demand.
- Skills, qualifications and training restrict supply and lift pay.
Strong Demand and Restricted Supply Lift Skilled Pay
- Skilled workers face high demand and limited, inelastic supply.
- Unskilled workers face plentiful supply and lower productivity.
- So the skilled earn more than the unskilled.
Example
- A surgeon is in high demand with a supply limited by years of training.
- A cleaner faces plentiful supply, so the wage is lower.
Compensating Differentials and Immobility Widen the Gap
- A compensating differential pays more for unpleasant or risky work.
- Immobility can keep regional pay gaps open.
- So differentials reflect both demand and supply together.
Use Both Blades of the Scissors
Exam technique
- Explain a differential with a demand and supply diagram.
- Link inelastic skilled-labour supply to higher pay.
Common Mistake
- Do not explain a differential by demand or supply alone.
- It is their interaction that sets the pay gap.
Case study
- Regional pay differentials in the UK partly reflect compensating differentials: wages in London and the South East are typically higher, offsetting a higher cost of living and longer commutes, and reflecting strong demand from high-productivity finance and professional services concentrated there.
- The NHS Agenda for Change pay structure includes higher bands and unsocial-hours payments for night and weekend shifts, a direct example of a compensating differential for less desirable working conditions.
Self review
- How is the competitive wage determined?
- What does it mean that a firm is a wage taker?
- What happens if the wage is above equilibrium?
- Why do skilled workers earn more, and what is a compensating differential?
- Why must you use both demand and supply to explain a differential?
- In the consultant vs cleaner worked example, if the cleaner's pay rose to £25,000\pounds 25{,}000£25,000, recalculate the ratio differential.
- Describe, in words, why an individual firm in a competitive labour market faces a horizontal (perfectly elastic) supply of labour.
