

What you'll learn
- How births, deaths, migration and limiting factors determine population size.
- Why predator–prey relationships and competition cause population changes.
- The difference between conservation and preservation, including economic, social and ethical reasons.
- How timber production and fishing can be managed sustainably while balancing human needs.
Starting point: populations in ecosystems
An ecosystem is all the living organisms in an area, plus the non-living conditions they interact with, such as temperature, water availability and soil mineral ions.
A species is a group of organisms that can breed together to produce fertile offspring. A habitat is the place where an organism lives.
Population size
A population is all the individuals of one species living in the same habitat at the same time. Its population size is the number of individuals, often represented by NNN.
Population size changes because of four direct processes:
- Births add individuals.
- Deaths remove individuals.
- Immigration is movement into the population.
- Emigration is movement out of the population.
A useful population balance is:
Nfinal=Ninitial+B+I−D−EN_{\text{final}} = N_{\text{initial}} + B + I - D - ENfinal=Ninitial+B+I−D−Ewhere BBB is births, III is immigration, DDD is deaths and EEE is emigration.
Calculating population change
A lake population starts with $1.20 \times 10^4$ fish. During one year, 2.8×1032.8 \times 10^32.8×10³ fish are born, 4.0×1024.0 \times 10^24.0×10² immigrate, 1.9×1031.9 \times 10^31.9×10³ die and 6.0×1026.0 \times 10^26.0×10² emigrate.
-
Identify gains and losses: births and immigration increase NNN; deaths and emigration decrease NNN.
-
Calculate the net change:
- Add the net change to the starting population:
Limiting factors and carrying capacity
A population cannot usually grow forever. Resources become scarce, waste may build up, and other organisms may affect survival.
Limiting factors and carrying capacity
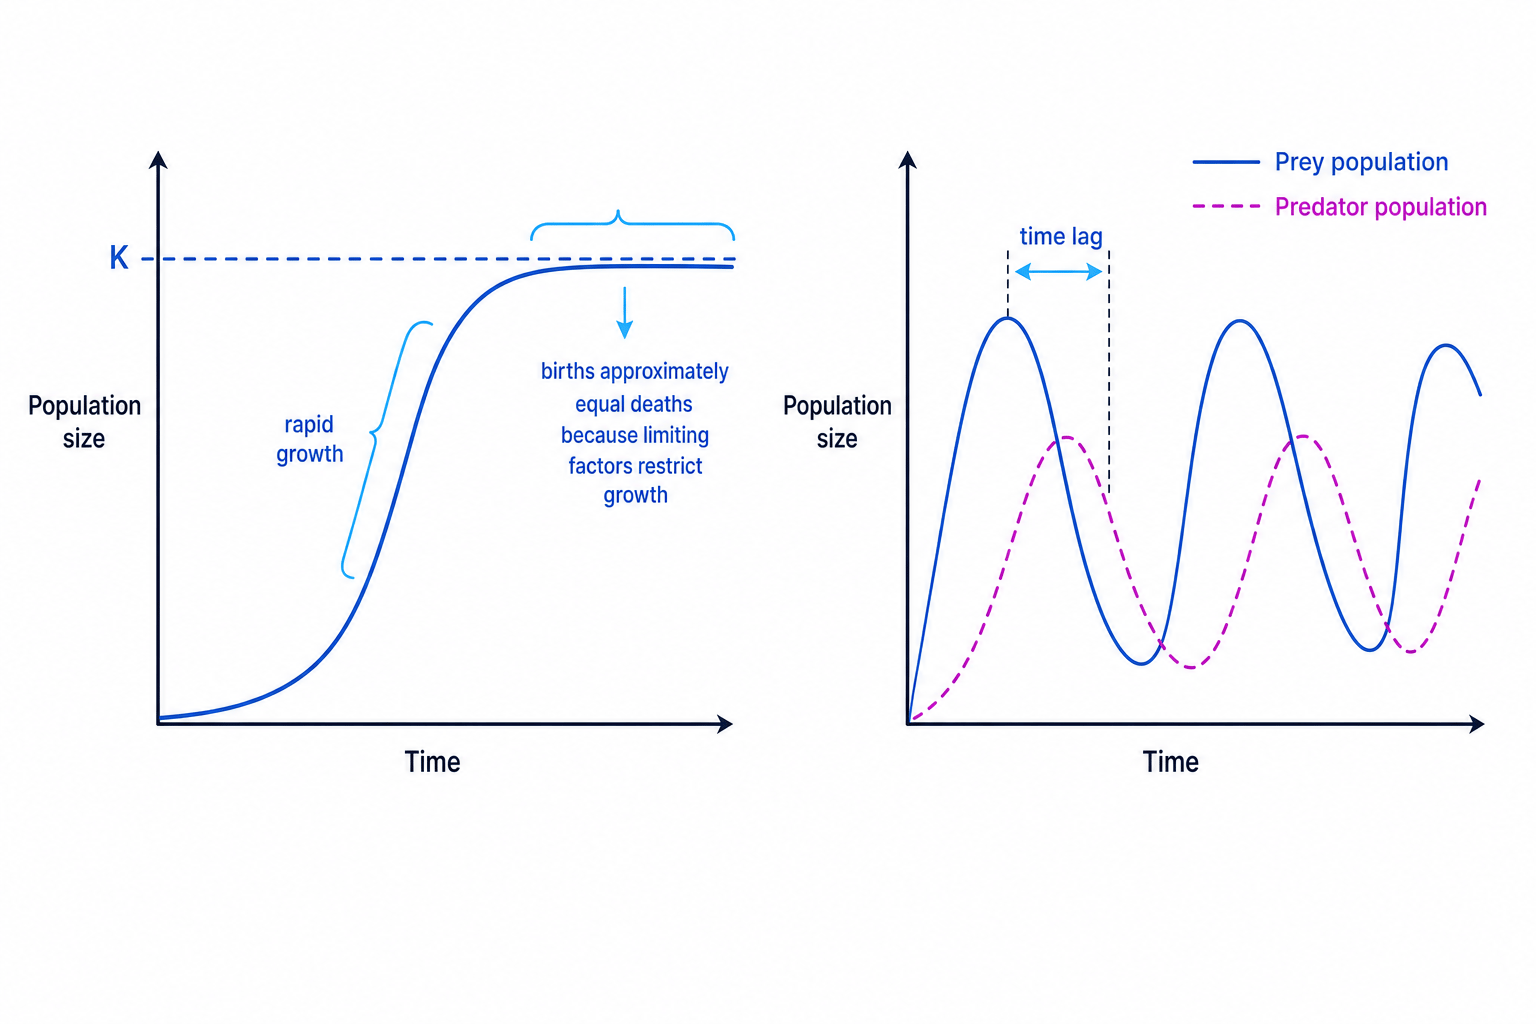
A limiting factor is an environmental factor that restricts population growth when it is in short supply, in excess, or otherwise unfavourable. Carrying capacity, often written as KKK, is the maximum stable population size that an environment can support over time.
Limiting factors may be abiotic — non-living factors such as light intensity, temperature, water, oxygen concentration, pH or mineral ions. They may also be biotic — living factors such as food availability, disease, predators, mates and competition for space.
When resources are plentiful, a population may grow rapidly. As the population approaches carrying capacity, limiting factors become more significant. Birth rate tends to fall, death rate tends to rise, and final population size levels off near KKK.
Carrying capacity is not fixed
Carrying capacity depends on the environment. If a limiting factor becomes less severe, carrying capacity may increase; if conditions worsen, carrying capacity may decrease.
Estimating mean growth rate
A population rises from 80 to 560 individuals between 2.0 years and 6.0 years, then later levels off near 900 individuals.
- Calculate the change in population size:
- Divide by the time interval to find the mean growth rate:
- Use the plateau to estimate carrying capacity: if the population levels off near 900 individuals, then K≈900 individualsK \approx 900\ \text{individuals}K≈900 individuals.
Interactions between populations
Competition
Competition occurs when organisms need the same limited resource. It reduces the amount of that resource available to each individual, so it can reduce growth, survival or reproduction.
Intraspecific competition is competition between individuals of the same species. This is often intense because individuals have very similar requirements.
Interspecific competition is competition between individuals of different species. If two species rely on the same limiting resource, one species may reduce the population size or distribution of the other.
Separating competition types
In a grassland, rabbits and sheep both eat grass. The rabbit population increases rapidly.
-
Rabbits competing with sheep for grass is interspecific competition, because rabbits and sheep are different species.
-
Rabbits competing with other rabbits for grass, burrows and mates is intraspecific competition, because the individuals are from the same species.
-
As rabbit density rises, each rabbit has access to less grass and space, so rabbit birth rate may fall or death rate may rise as the population approaches carrying capacity.
Predator–prey relationships
A predator is an organism that kills and eats another organism. The organism eaten is the prey.
Predator and prey populations often show linked cycles:
- Prey population increases, so predators have more food.
- Predator survival and reproduction increase, so predator population rises after a time lag.
- More predators kill more prey, so prey population falls.
- With fewer prey available, predator population then falls.
Real ecosystems are more complicated than perfect graph cycles because weather, disease, migration and human activity can also affect population size.
Predator–prey time lag
The predator population usually peaks after the prey population, not before it. Predator numbers take time to respond because reproduction and survival do not change instantly.
Explaining a predator-prey cycle
A graph shows a hare population peaking in spring and a fox population peaking later in summer.
-
When hare numbers increase, foxes have more food, so fox survival improves and more foxes can reproduce.
-
The fox population peaks later because gestation, growth of young and improved survival all take time.
-
Once fox numbers are high, predation on hares increases, causing the hare population to fall; later, reduced hare availability causes the fox population to fall too.
Conservation, preservation and why they matter
Biodiversity is the variety of living organisms, including variation between species and genetic variation within species. Biological resources are useful living resources or products from organisms, such as fish, timber, crops, medicines and genetic material.
Conservation and preservation
- Conservation is the active management of ecosystems and biological resources to maintain biodiversity and allow sustainable use.
- Preservation is the protection of species or habitats by keeping them as undisturbed as possible, often preventing exploitation.
Conservation is important for several types of reason:
- Economic reasons: ecosystems provide food, timber, medicines, tourism income and ecosystem services. Ecosystem services are benefits humans gain from ecosystems, such as pollination, soil formation, water purification and flood protection.
- Social reasons: ecosystems support recreation, education, cultural identity, food security and livelihoods.
- Ethical reasons: many people argue that other species have intrinsic value, and that humans have a responsibility to prevent extinctions, especially when human activity caused the threat.
Use versus no use
In exam answers, link conservation with managed sustainable use, and preservation with preventing disturbance or exploitation.
Sustainable management of resources
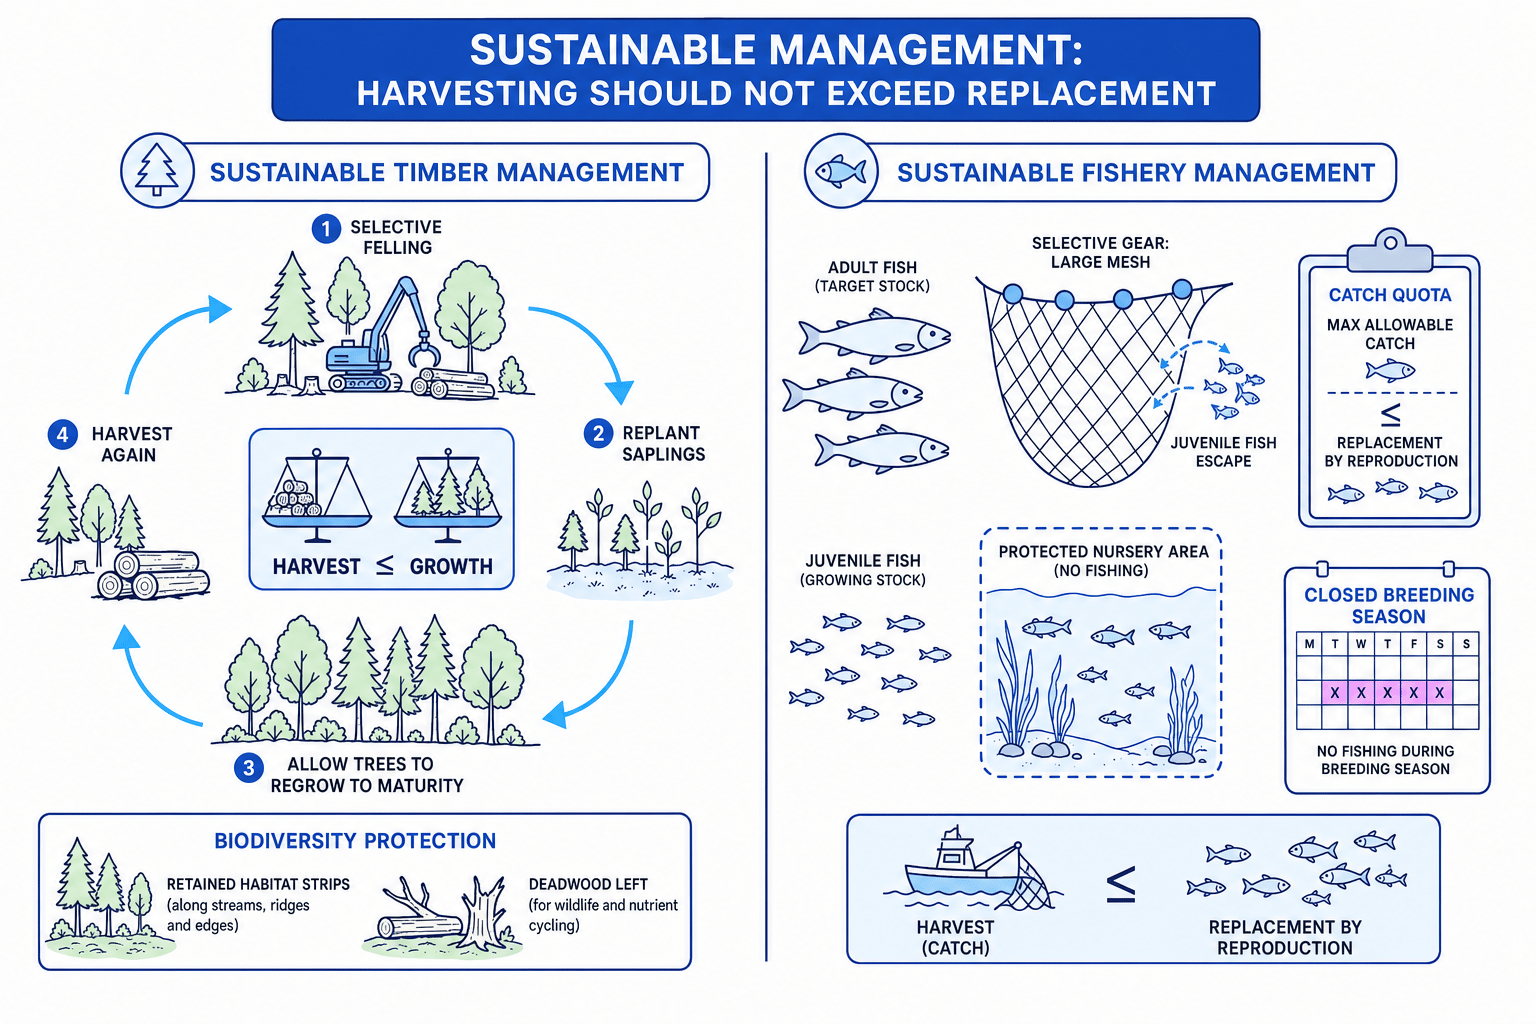
Sustainability means using resources in a way that meets current human needs without preventing future generations from meeting theirs. In population terms, harvesting must not remove organisms faster than they are replaced by growth and reproduction.
sustainable harvest: harvest≤replacement by growth and reproduction\text{sustainable harvest: harvest} \le \text{replacement by growth and reproduction}sustainable harvest: harvest≤replacement by growth and reproductionThe diagram compares sustainable management of timber and fish stocks.
Sustainable timber production
Timber can be managed sustainably by:
- Selective felling: removing only some mature trees, rather than clearing the whole area.
- Rotational harvesting: harvesting different areas at different times so some areas are always regrowing.
- Replanting: planting saplings to replace felled trees.
- Maintaining biodiversity: leaving habitat corridors, deadwood and mixed-age woodland where possible.
- Protecting soil: reducing erosion and nutrient loss so the forest can regrow.
Sustainable fishing
Fish populations can collapse if too many breeding adults are removed. Sustainable fishing aims to maintain the breeding stock and allow juveniles to reach reproductive age.
Methods include:
- Catch quotas: legal limits on the mass or number of fish caught.
- Minimum mesh sizes: larger holes in nets allow smaller juvenile fish to escape.
- Minimum landing sizes: fish below a set size must not be kept.
- Closed seasons: no fishing during breeding periods.
- Protected nursery areas: no fishing in important breeding or juvenile habitats.
- Monitoring and enforcement: population surveys and inspections help managers adjust rules.
Sustainable harvesting
Sustainable harvesting does not mean harvesting nothing. It means harvesting at a rate that the population and ecosystem can replace over time.
Checking whether a catch is sustainable
A fish stock gains 6.0×10⁶ kg year−16.0 \times 10^6\ \text{kg year}^{-1}6.0×10⁶ kg year−1 through growth and reproduction. Fishing removes 4.5×10⁶ kg year−14.5 \times 10^6\ \text{kg year}^{-1}4.5×10⁶ kg year−1.
-
Compare replacement and catch using the same units: both are measured in kg year⁻¹, so they can be compared directly.
-
Calculate the net change in stock:
- Interpret the result: the net change is positive, so the catch is below replacement in this simplified case. The stock should increase if other factors, such as habitat quality and by-catch, are controlled.
Managing environmental resources and human activity
Humans need resources such as food, water, land, timber, fish and energy. This can conflict with conservation or preservation because resource extraction often changes habitats and population sizes.
Good ecosystem management tries to balance these needs by using evidence, monitoring and compromise. For example, one area may be preserved as a reserve, another conserved through sustainable harvesting, and another used for housing or farming with strict environmental controls.
| Human activity | Effect on plant and animal populations | Possible controls |
|---|---|---|
| Deforestation and land clearance | Habitat loss, fragmentation, reduced carrying capacity | Protected areas, wildlife corridors, selective felling, replanting, environmental impact assessments |
| Overfishing or hunting | Fewer breeding adults, population decline, possible extinction | Quotas, licences, closed seasons, minimum sizes, protected areas |
| Fertiliser or sewage pollution | Eutrophication, algal blooms, reduced dissolved oxygen, death of aquatic organisms | Sewage treatment, fertiliser limits, buffer strips, water quality monitoring |
| Pesticide pollution | Direct toxicity, reduced food supply, effects through food chains | Regulation, targeted use, biological control, less persistent chemicals |
| Introduction of non-native species | New predators, competitors or diseases | Biosecurity, quarantine, removal or control programmes |
| Climate change | Range shifts, changed breeding times, food web disruption | Emissions reduction, habitat restoration, connected habitats |
Adaptive management
Ecosystem management should be evidence-based and flexible: measure population trends, set limits, monitor the outcome, then change the strategy if populations or habitats are not recovering.
In the exam
- When asked about population size, separate direct changes such as births, deaths and migration from limiting factors that set carrying capacity.
- On predator–prey graphs, explain both populations and the time lag; do not just write “they fluctuate”.
- For sustainability questions, link each method to how it protects future resource supply, such as maintaining breeding stock, allowing juveniles to mature or enabling tree regrowth.
- For conservation decisions, include economic, social and ethical reasons when the question asks for reasons or evaluation.
Check yourself
- What happens to final population size if the main limiting factor becomes less severe?
- Why does a predator population usually peak after the prey population?
- Give one sustainable timber method and one sustainable fishing method, and explain how each prevents resource depletion.
