Size And Sign
Definition
Coefficient of price elasticity of supply: the numerical value of PES, whose size shows how strongly quantity supplied responds to price and whose sign shows the direction of that response.
PES=% ΔQs% ΔP \text{PES} = \dfrac{\%\,\Delta Q_s}{\%\,\Delta P} PES=%ΔP%ΔQsCategories By Size
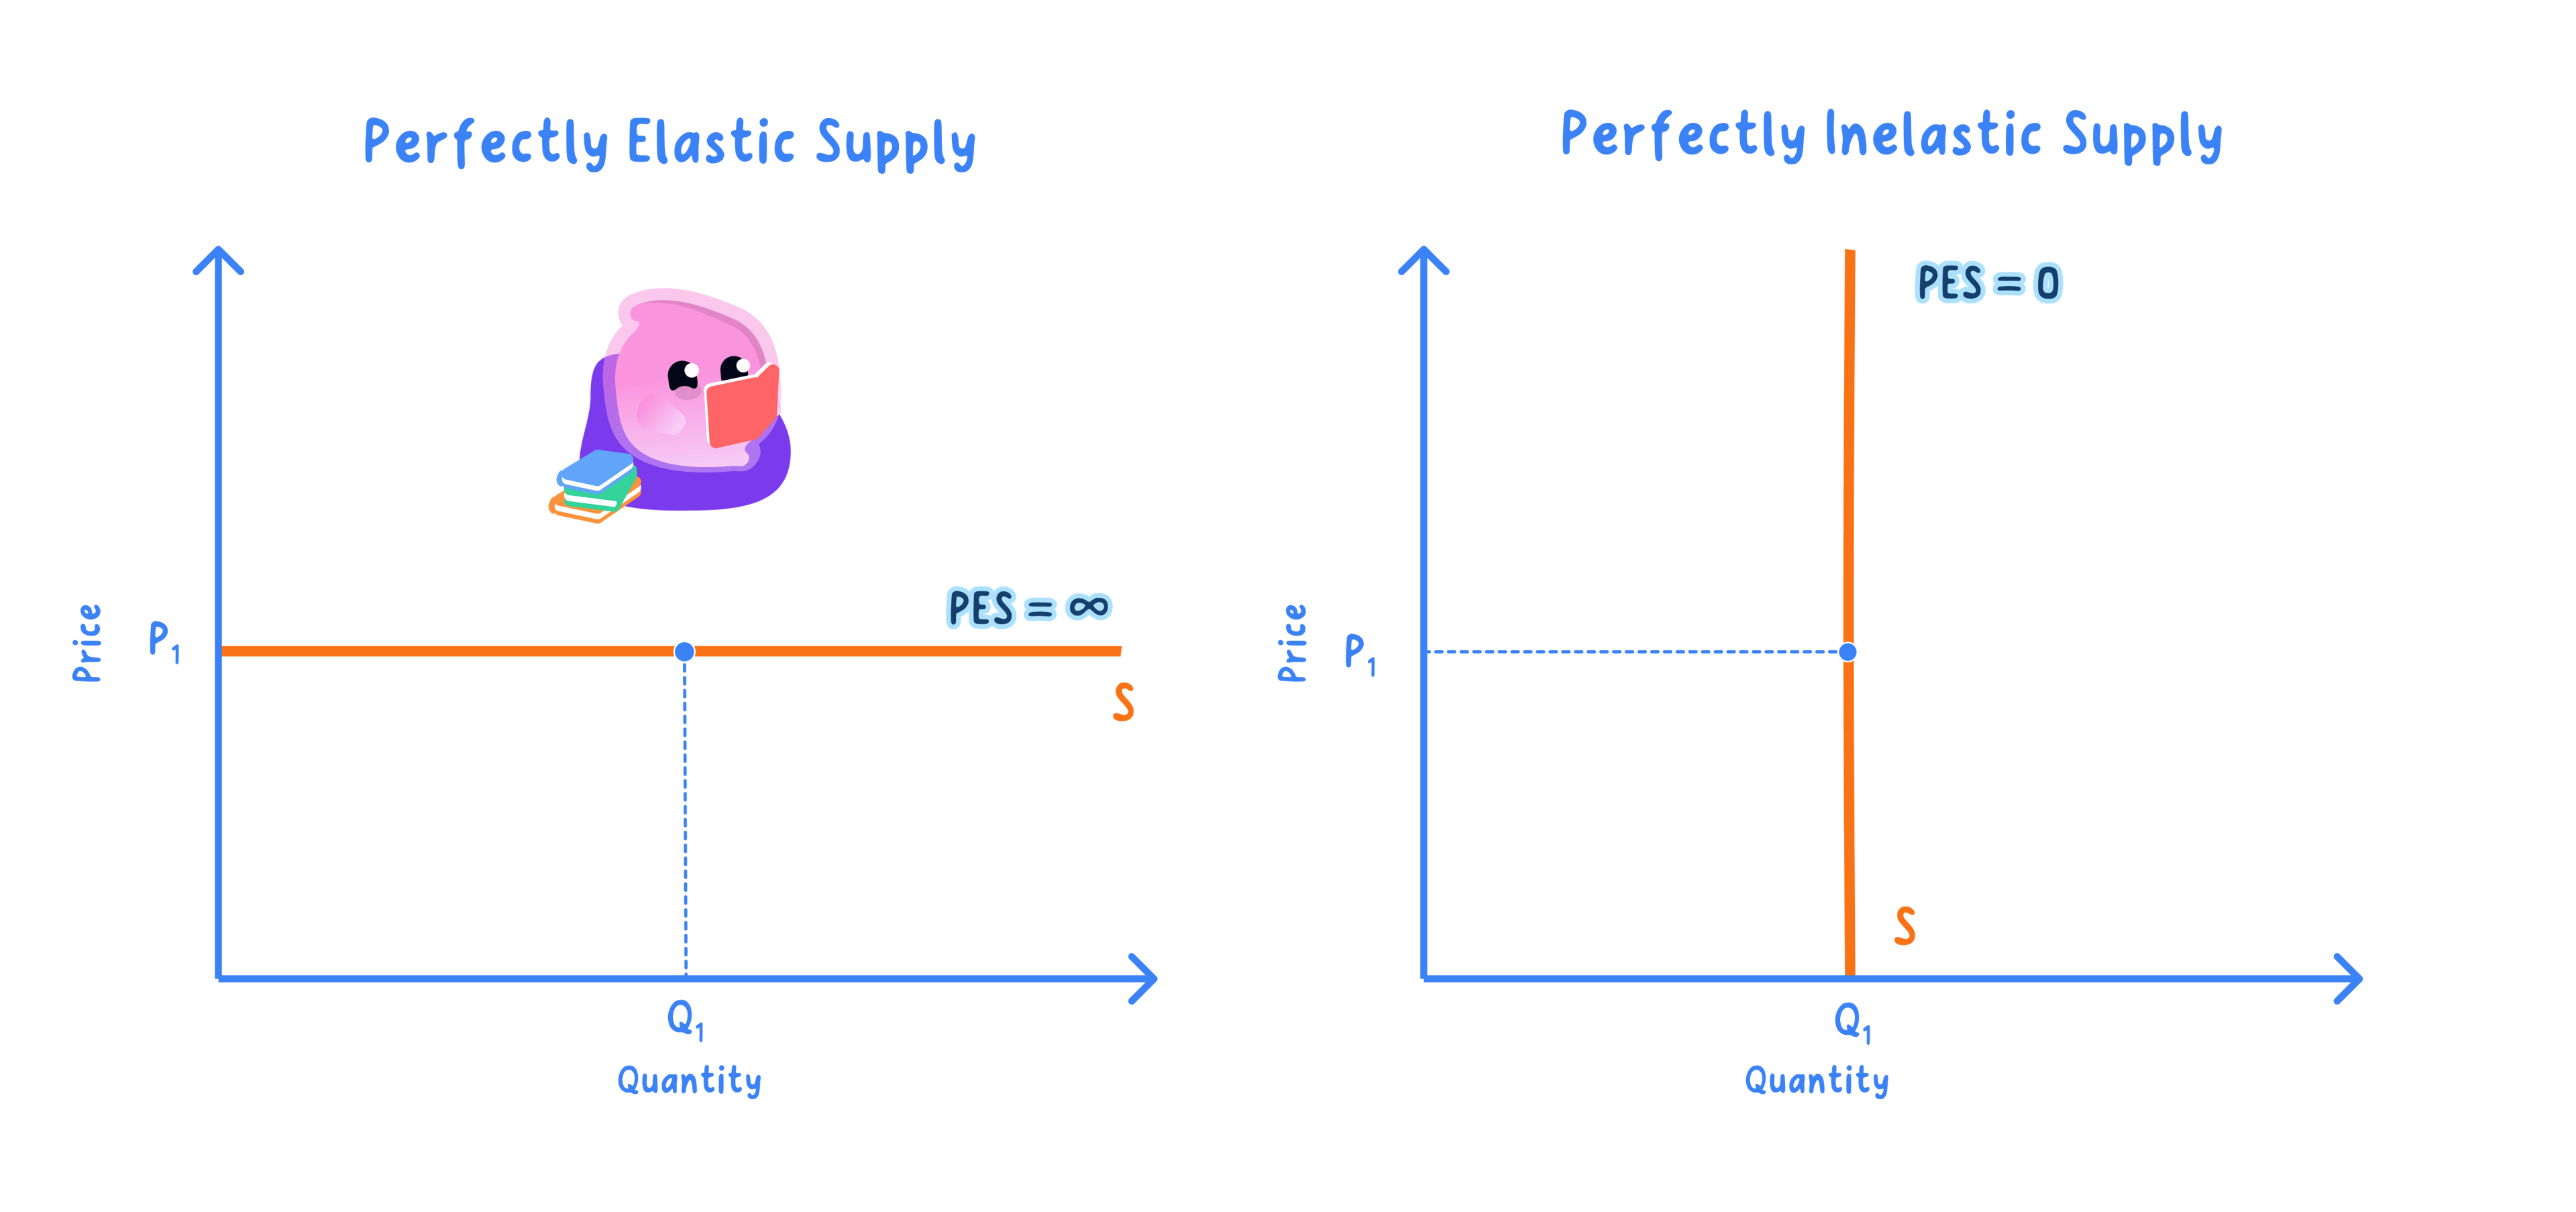
- Perfectly inelastic (PES = 0)
- Quantity supplied does not change at all when price changes, giving a vertical supply curve; an original Van Gogh painting is the classic case, as no price rise can conjure a second one.
- Inelastic (between 0 and 1)
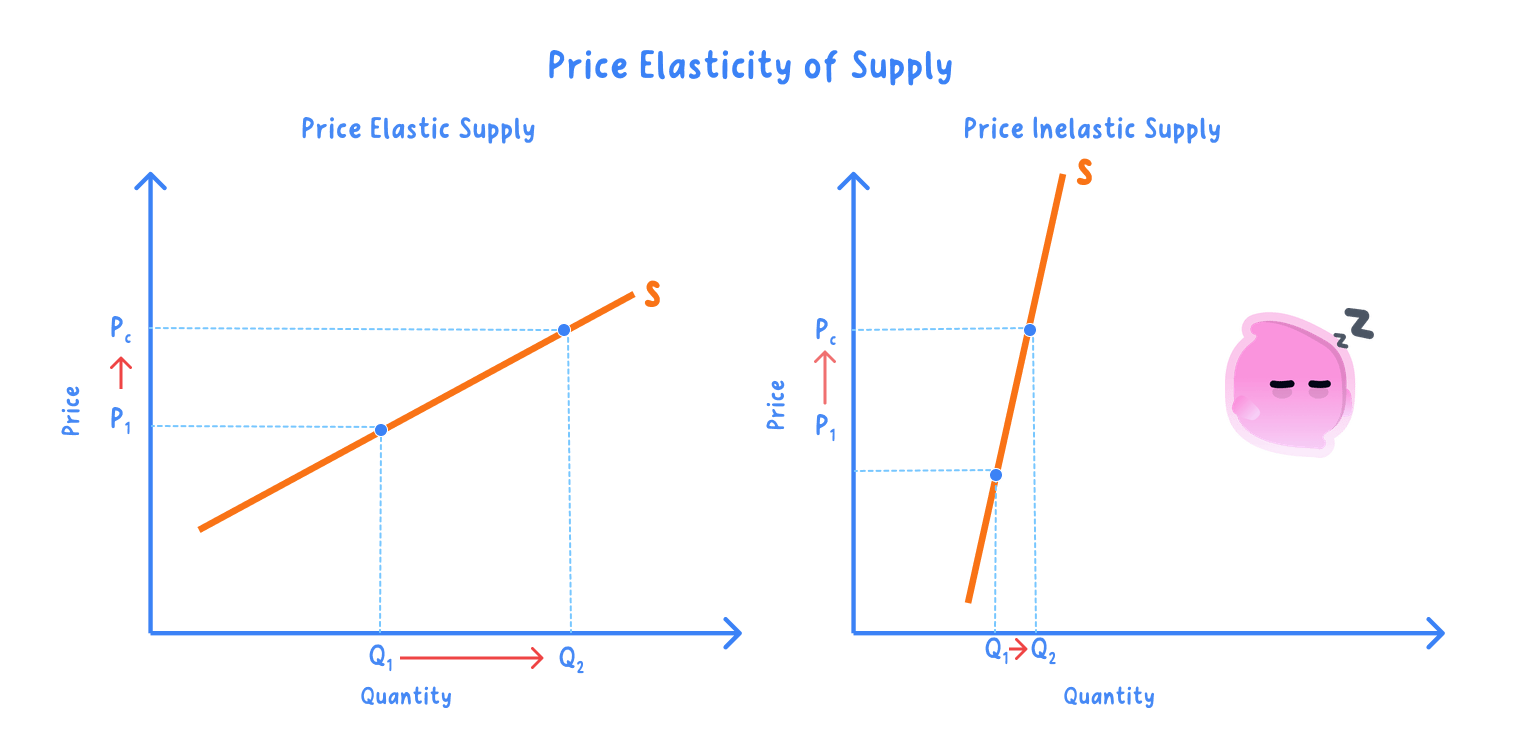
- Supply responds, but by a smaller percentage than the price change that caused it; wheat within a single season fits here, because a mid-season price rise cannot bring the next harvest forward.
- Unit elastic (PES = 1)
- Supply changes in exact proportion to the price change, so a +10% price rise brings a +10% rise in quantity supplied.
- Elastic (greater than 1)
- Supply responds by a larger percentage than the price change; a T-shirt factory with idle machines and warehoused stock can lift output sharply when price rises.
- Perfectly elastic (PES infinite)
- Firms will supply any quantity at the going price but nothing below it, giving a horizontal supply curve, as with a single small farmer selling wheat at the world price.
Note
- A PES of 0.3 means a steep supply curve where output barely responds to price.
- A PES of 3 means a flatter supply curve where output responds strongly, so the larger the number, the more responsive supply is.
The Sign Of PES
- The sign of PES is normally positive, because the supply curve slopes upward.
- A higher price raises the reward per unit, so firms expand output and quantity supplied rises alongside price.
- The positive sign therefore confirms that quantity supplied moves in the same direction as price.
Why It Matters
- The size tells you how a market will absorb a change in demand.
- It shows whether price or quantity will move more once the market adjusts.
- With inelastic supply a demand rise mainly raises price, whereas with elastic supply it mainly raises quantity; that is why a sudden surge in demand for a fixed-supply good like tickets to a cup final sends the price soaring rather than the number of seats.
Behind The Coefficient
- A high PES usually reflects spare capacity, mobile factors or a long time horizon that let firms adjust easily.
- A low PES reflects fixed capacity, immobile factors or a short time frame that hold output back.
- Interpreting the value therefore also means asking why supply is that responsive.
Exam technique
- State the category from the size and confirm the positive sign.
- Link the value back to the underlying supply conditions.
- Use it to predict the price and quantity effect of a demand shift.
Common Mistake
- Do not expect a negative PES in normal cases; supply slopes upward, so PES is normally positive.
- Do not stop at the number without saying what its size means for supply.
Self review
- What does a PES of 0 mean?
- Is a PES of 0.3 elastic or inelastic?
- Why is the PES sign normally positive?
- With inelastic supply, does a demand rise move price or quantity more?
- What underlying conditions produce a high PES?
