Market structures
- Economists sort markets along a spectrum using four features: how many firms there are and how large they are, how far the product is differentiated, how high the barriers to entry and exit are, and how good buyers' and sellers' information is.
- These features decide the single thing that drives a firm's behaviour: how much power it has over its own price. The more firms there are, the more identical the product, and the freer entry is, the less power any one firm holds.
- At one extreme, perfect competition has so many firms selling an identical good that each is a pure price taker. At the other, a monopoly is the only seller and the strongest price maker. Monopolistic competition and oligopoly lie in between.
- Two results follow from structure: the shape of the firm's demand curve (flat for a price taker, downward sloping for a price maker) and how much profit survives in the long run (only normal profit where entry is free, supernormal profit where barriers are high).
Perfect competition: a market with very many small, price-taking firms selling an identical product, with free entry and exit and perfect information.
Imperfect competition: any market where firms have some price-setting power, covering monopolistic competition, oligopoly and monopoly.
Price taker: a firm so small relative to the market that it must accept the ruling market price and faces a perfectly elastic, horizontal demand curve.
Price maker: a firm that faces a downward-sloping demand curve and can choose either its price or its output, but not both.
The four structures at a glance
| Feature | Perfect competition | Monopolistic competition | Oligopoly | Monopoly |
|---|---|---|---|---|
| Number of firms | Very many, small | Many | Few, large | One (or a dominant firm) |
| Product | Identical | Differentiated | Identical or differentiated | Unique, no close substitute |
| Barriers to entry | None | Low | High | Very high |
| Price power | Price taker | Weak price maker | Strong price maker | Strongest price maker |
| Firm demand curve | Horizontal, P = AR = MR | Downward, elastic | Kinked or downward | Downward = market demand, MR < AR |
| Long-run profit | Normal only | Normal only | Supernormal possible | Supernormal |
| Information | Perfect | Fairly good | Imperfect | Imperfect |
| Examples | Wheat, foreign exchange | Restaurants, hairdressers | Supermarkets, mobile networks | Regional water supply |
Perfect competition
- Very many small firms each sell a homogeneous (identical) product, so buyers have no reason to prefer one seller and will switch to anyone charging even slightly less.
- There is freedom of entry and exit and perfect information, so no firm has a cost or knowledge advantage and any profit is quickly noticed by potential entrants.
- Each firm's output is tiny relative to the market, so it cannot influence the price and must accept it: it is a price taker.
- Its demand curve is therefore horizontal at the market price, giving P = AR = MR, because every extra unit sells at the same fixed price, so average and marginal revenue both equal that price.
- The market price itself is set by total supply and demand; the firm only chooses how much to produce, maximising profit where MC = MR.
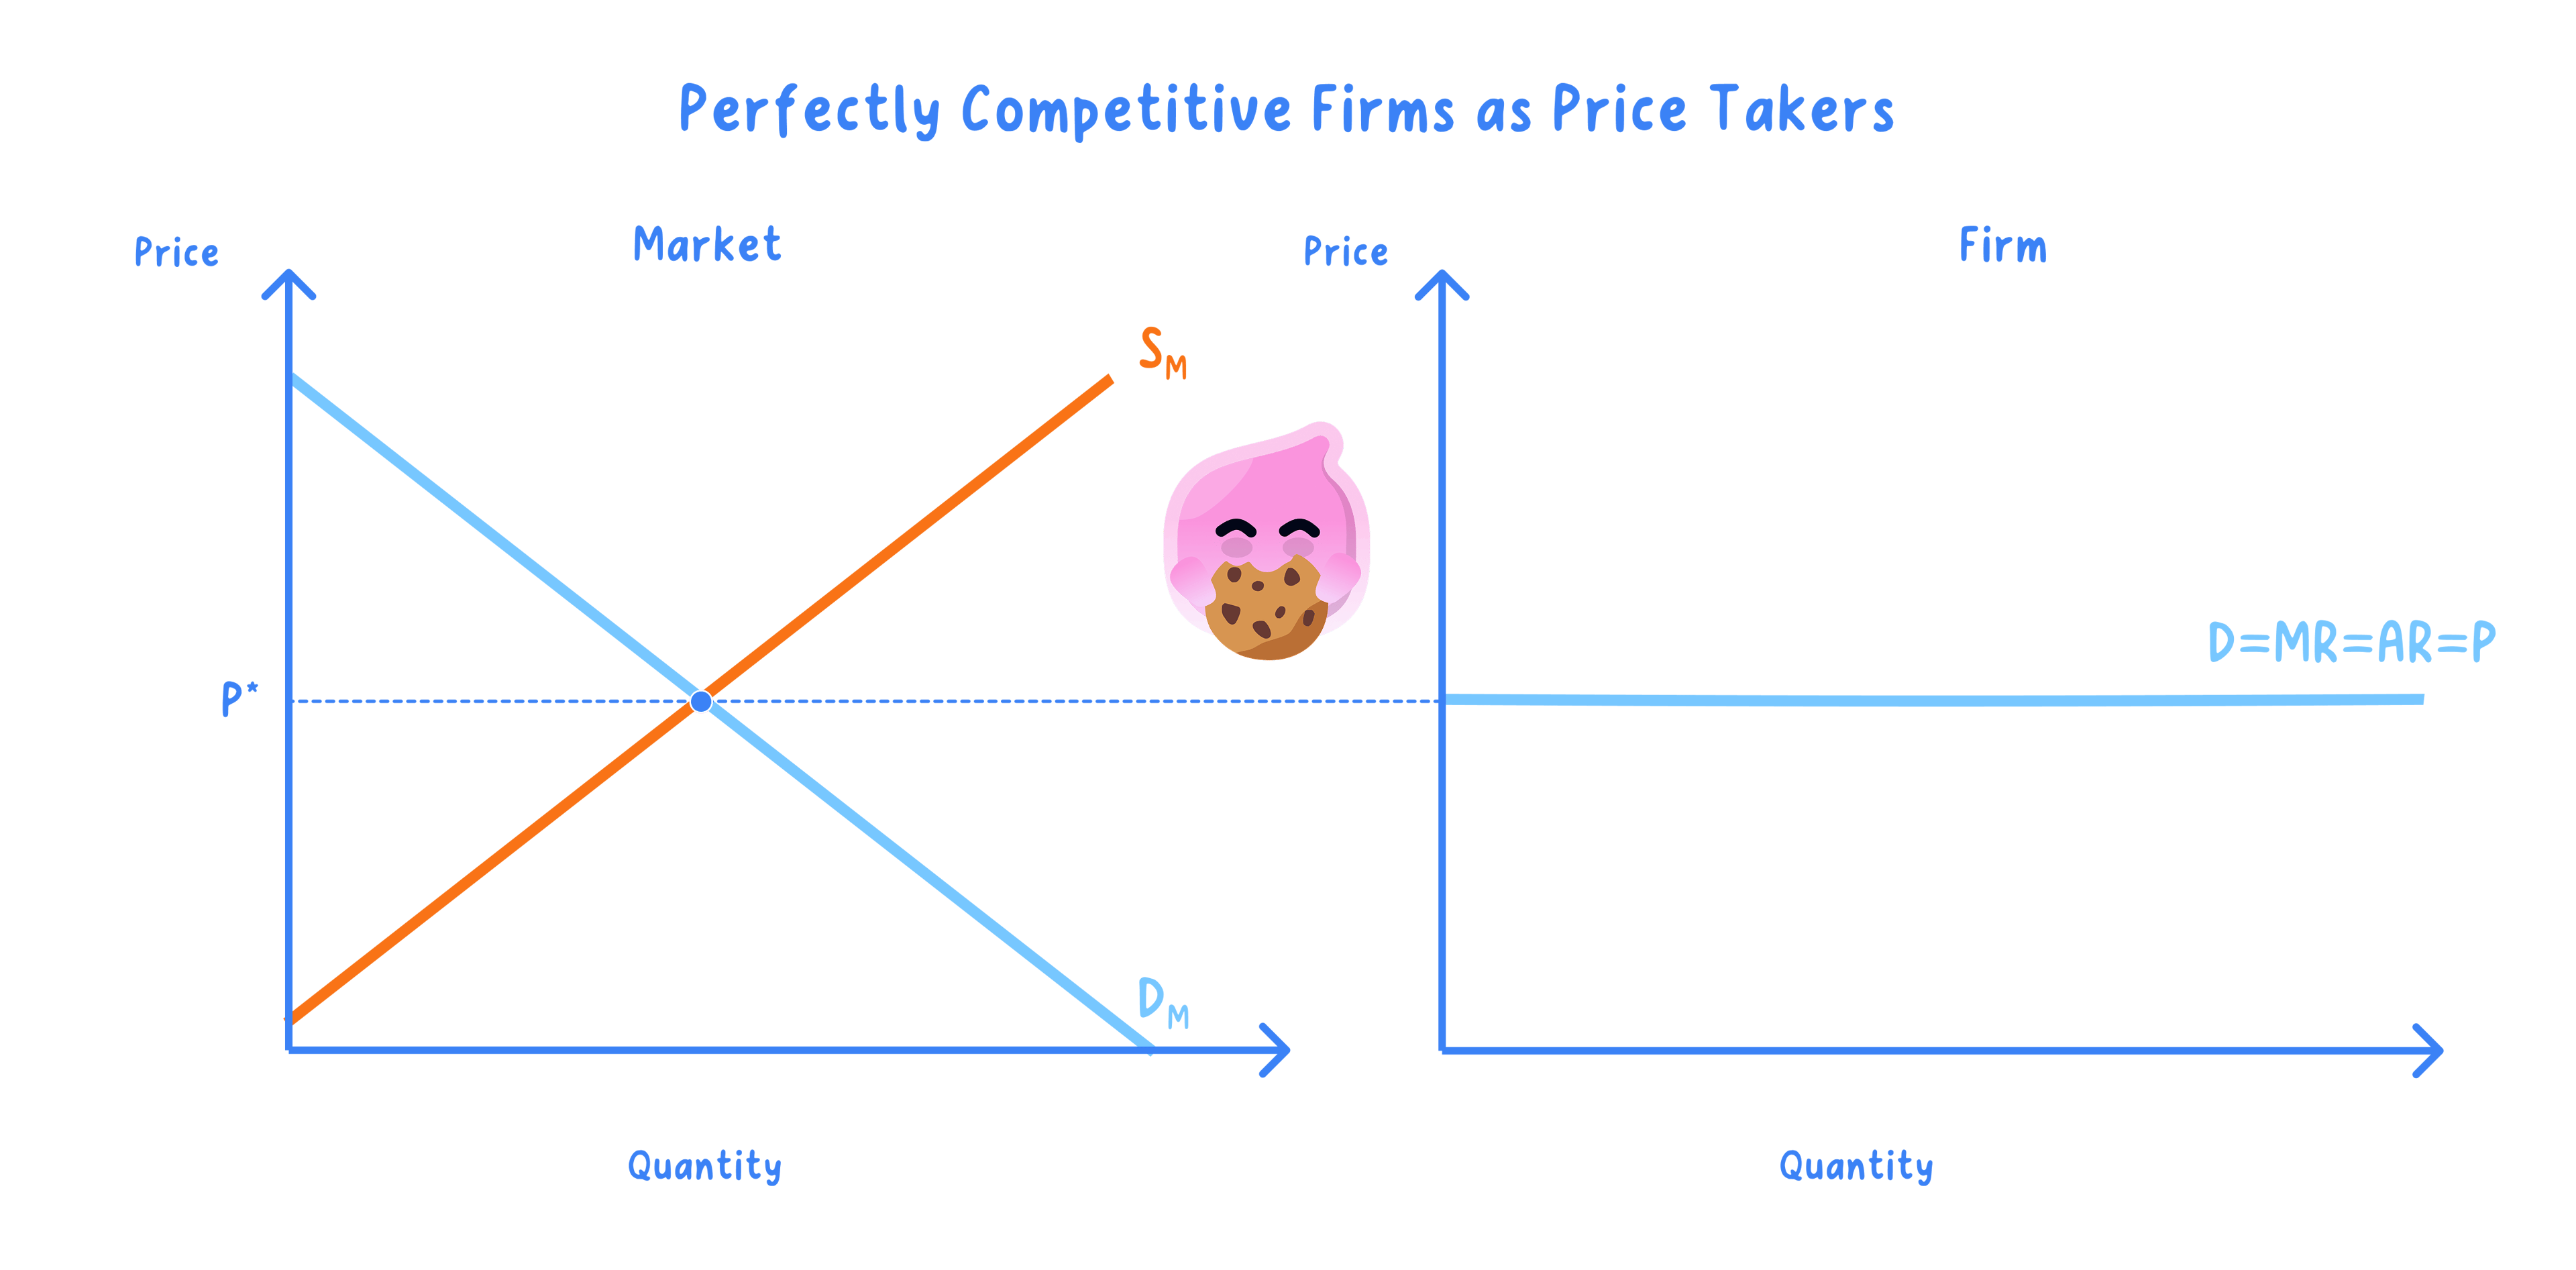
- The left panel is the whole market, where supply and demand set the price P.
- The right panel is one firm: its demand is the horizontal line D = AR = MR at that price, showing it can sell any quantity it likes, but only at P.
- The firm maximises profit where MC cuts MR from below. In long-run equilibrium this point sits at the lowest point of average cost, so only normal profit is earned.
- In the short run a firm can earn supernormal profit, normal profit or a loss, depending on where its average cost sits relative to the price.
- In the long run, supernormal profit attracts entry, which raises market supply and lowers the price until only normal profit remains; losses cause exit until the price rises back to normal profit.
- Because the long-run outcome is P = MC (allocative efficiency) at the lowest point of AC (productive efficiency), perfect competition is the efficiency benchmark. The full performance comparison is developed in 7.6.4.
- Parts of agriculture, such as the market for one wheat variety, and currency trading in the foreign exchange market come close to this model.
- No single grower or trader can move the market price, so each simply buys or sells all it wants at the going rate.
Worked example: P = AR = MR
- A single wheat farmer sells at the market price of £180 per tonne and supplies well under 1% of national output, so the price is fixed for the farm.
- Selling 500 tonnes gives TR = £180 × 500 = £90,000.
- So average revenue is £180, equal to the market price.
- Each extra tonne adds exactly £180, so MR = £180 too, confirming P = AR = MR = £180.
- The farmer maximises profit by producing where MC = MR = £180, the price-taker's rule.
Monopoly
Pure monopoly: a single seller that supplies the whole market for a good with no close substitutes, protected by high barriers to entry.
Working (legal) monopoly: in practice, a firm with a dominant market share (for example 25% or more) that can act as a price maker, even if it is not the only seller.
- A single firm is the whole industry, so the firm's demand curve is the market demand curve and slopes downward.
- To sell an extra unit the monopolist must lower the price on all units, so marginal revenue is below average revenue at every output (MR < AR) and falls twice as steeply.
- Very high barriers to entry, such as economies of scale, patents, legal licences, control of a key resource or strong brands, keep rivals out, so supernormal profit is not competed away and survives into the long run. Barriers are covered fully in 7.6.3.
- The firm maximises profit where MC = MR, then reads the price up to the demand (AR) curve, so price is set above marginal cost (P > MC).
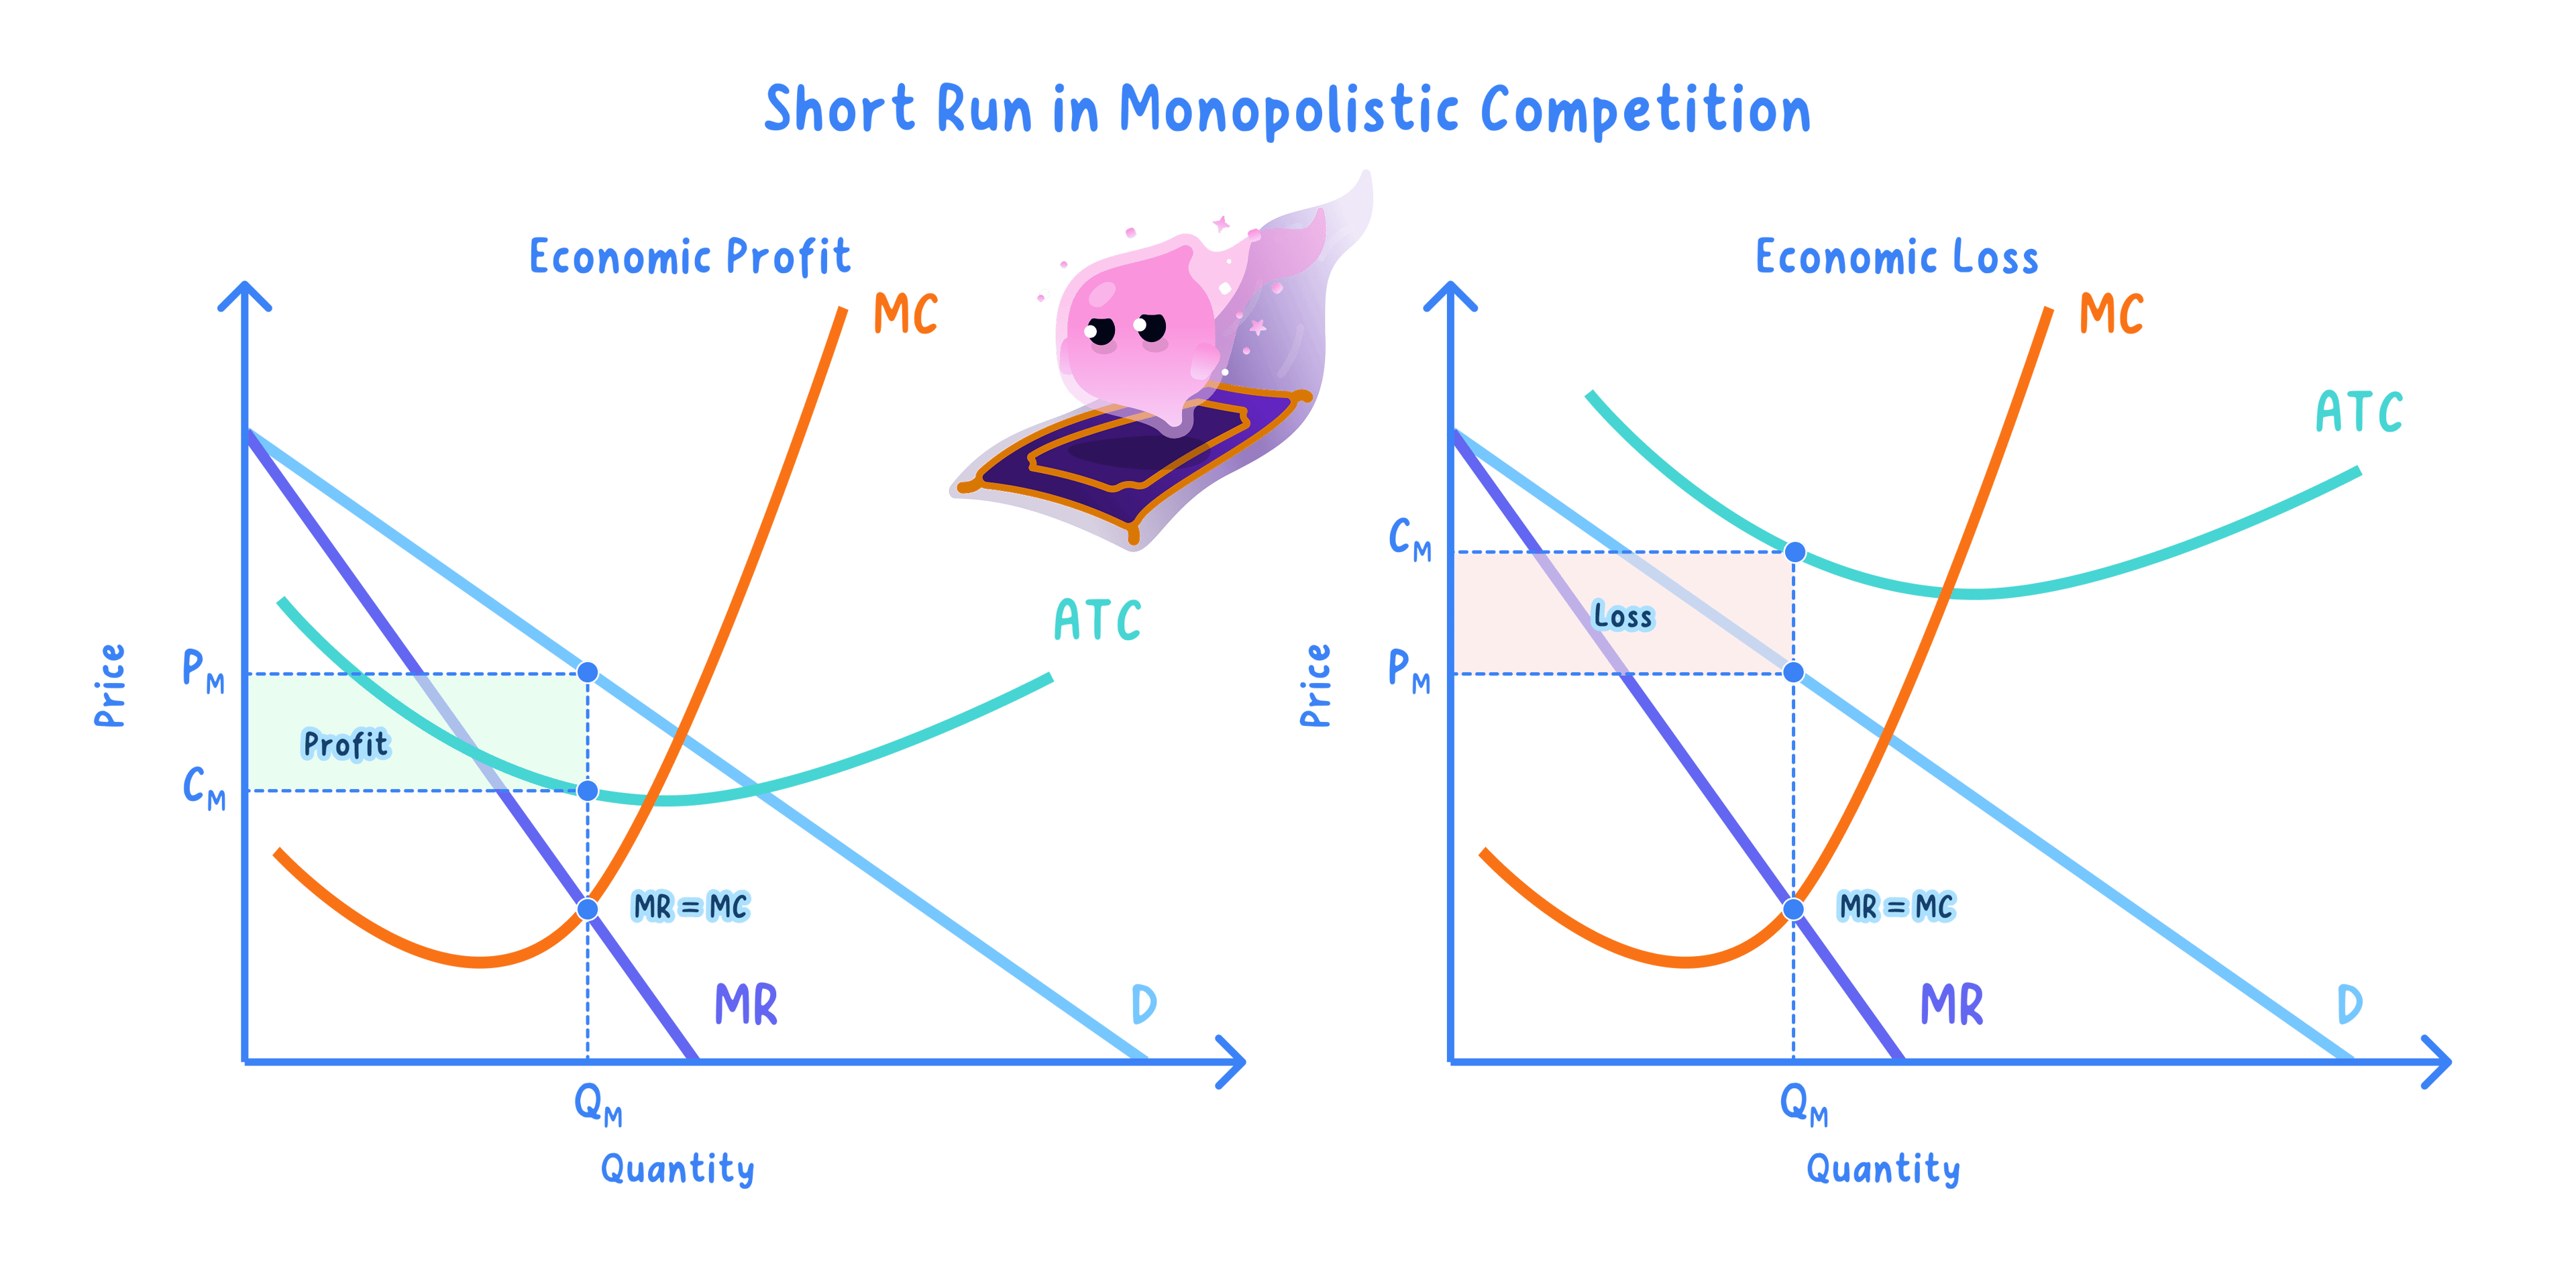
- Output is set where MC = MR (Qm); the price Pm is read up to the AR curve above that output.
- Supernormal profit is the rectangle between price and average cost at Qm, and high barriers let it persist in the long run.
- Because Pm is above MC, output is below the allocatively efficient level, so a monopoly is usually allocatively inefficient and need not produce at the lowest point of AC.
- Against this, a monopolist's size can bring large economies of scale, and its supernormal profit can fund research and development, so it is not always worse for consumers; the full evaluation is developed in 7.6.4.
- A sole licensed water supplier for a region is a monopoly with no substitute for households, and a dominant search engine holds monopoly power in online search.
- Each can hold price above marginal cost, which is why such firms are often regulated.
Monopolistic competition
Monopolistic competition: a market with many firms selling differentiated (non-identical) products, with low barriers to entry.
- Many firms compete, but each sells a slightly differentiated product through brand, quality, style or location, which gives it a little price-setting power.
- Its demand curve therefore slopes gently downward and is relatively elastic, because many close substitutes exist: raise the price a little and most, but not all, customers switch away.
- Firms compete heavily on non-price factors such as branding, service and location, not just on price.
- Barriers to entry are low, so short-run supernormal profit attracts new firms; entry shifts each existing firm's demand curve to the left until only normal profit remains in the long run.
- The long-run equilibrium leaves firms with spare (excess) capacity, producing below the lowest point of AC, so they are less efficient than under perfect competition, though consumers gain wider variety and choice.
- Independent restaurants, hairdressers, coffee shops and plumbers each offer a slightly different product at a slightly different price.
- Any one can lift its price a little without losing all its custom, but cannot hold supernormal profit because new rivals keep entering.
Oligopoly
Oligopoly: a market dominated by a few large firms, each supplying a significant share of total output.
Interdependence: each firm's best decision depends on how it expects its rivals to react, so firms cannot plan in isolation.
- A few large firms dominate, shown by a high concentration ratio, the combined market share of the largest few firms (covered in 7.6.5).
- High barriers to entry protect the incumbents, so they can earn supernormal profit in the long run.
- The defining feature is interdependence: because each firm is large, one firm's price or output change noticeably affects the others, so every firm must anticipate rivals' reactions before it acts.
- Interdependence pulls firms in two directions: they may collude, through a formal cartel or a tacit understanding, to raise prices together and behave like a monopoly, or they may compete fiercely in a price war that harms them all.
- To avoid destructive price wars, firms often keep prices stable and compete instead through advertising, loyalty schemes and product features, known as non-price competition.
- Price stability is often explained by the kinked demand curve: rivals match a price cut but ignore a price rise, so demand is elastic above the current price and inelastic below it, and the firm gains little either way from changing price. This model is developed fully in 7.8.5.
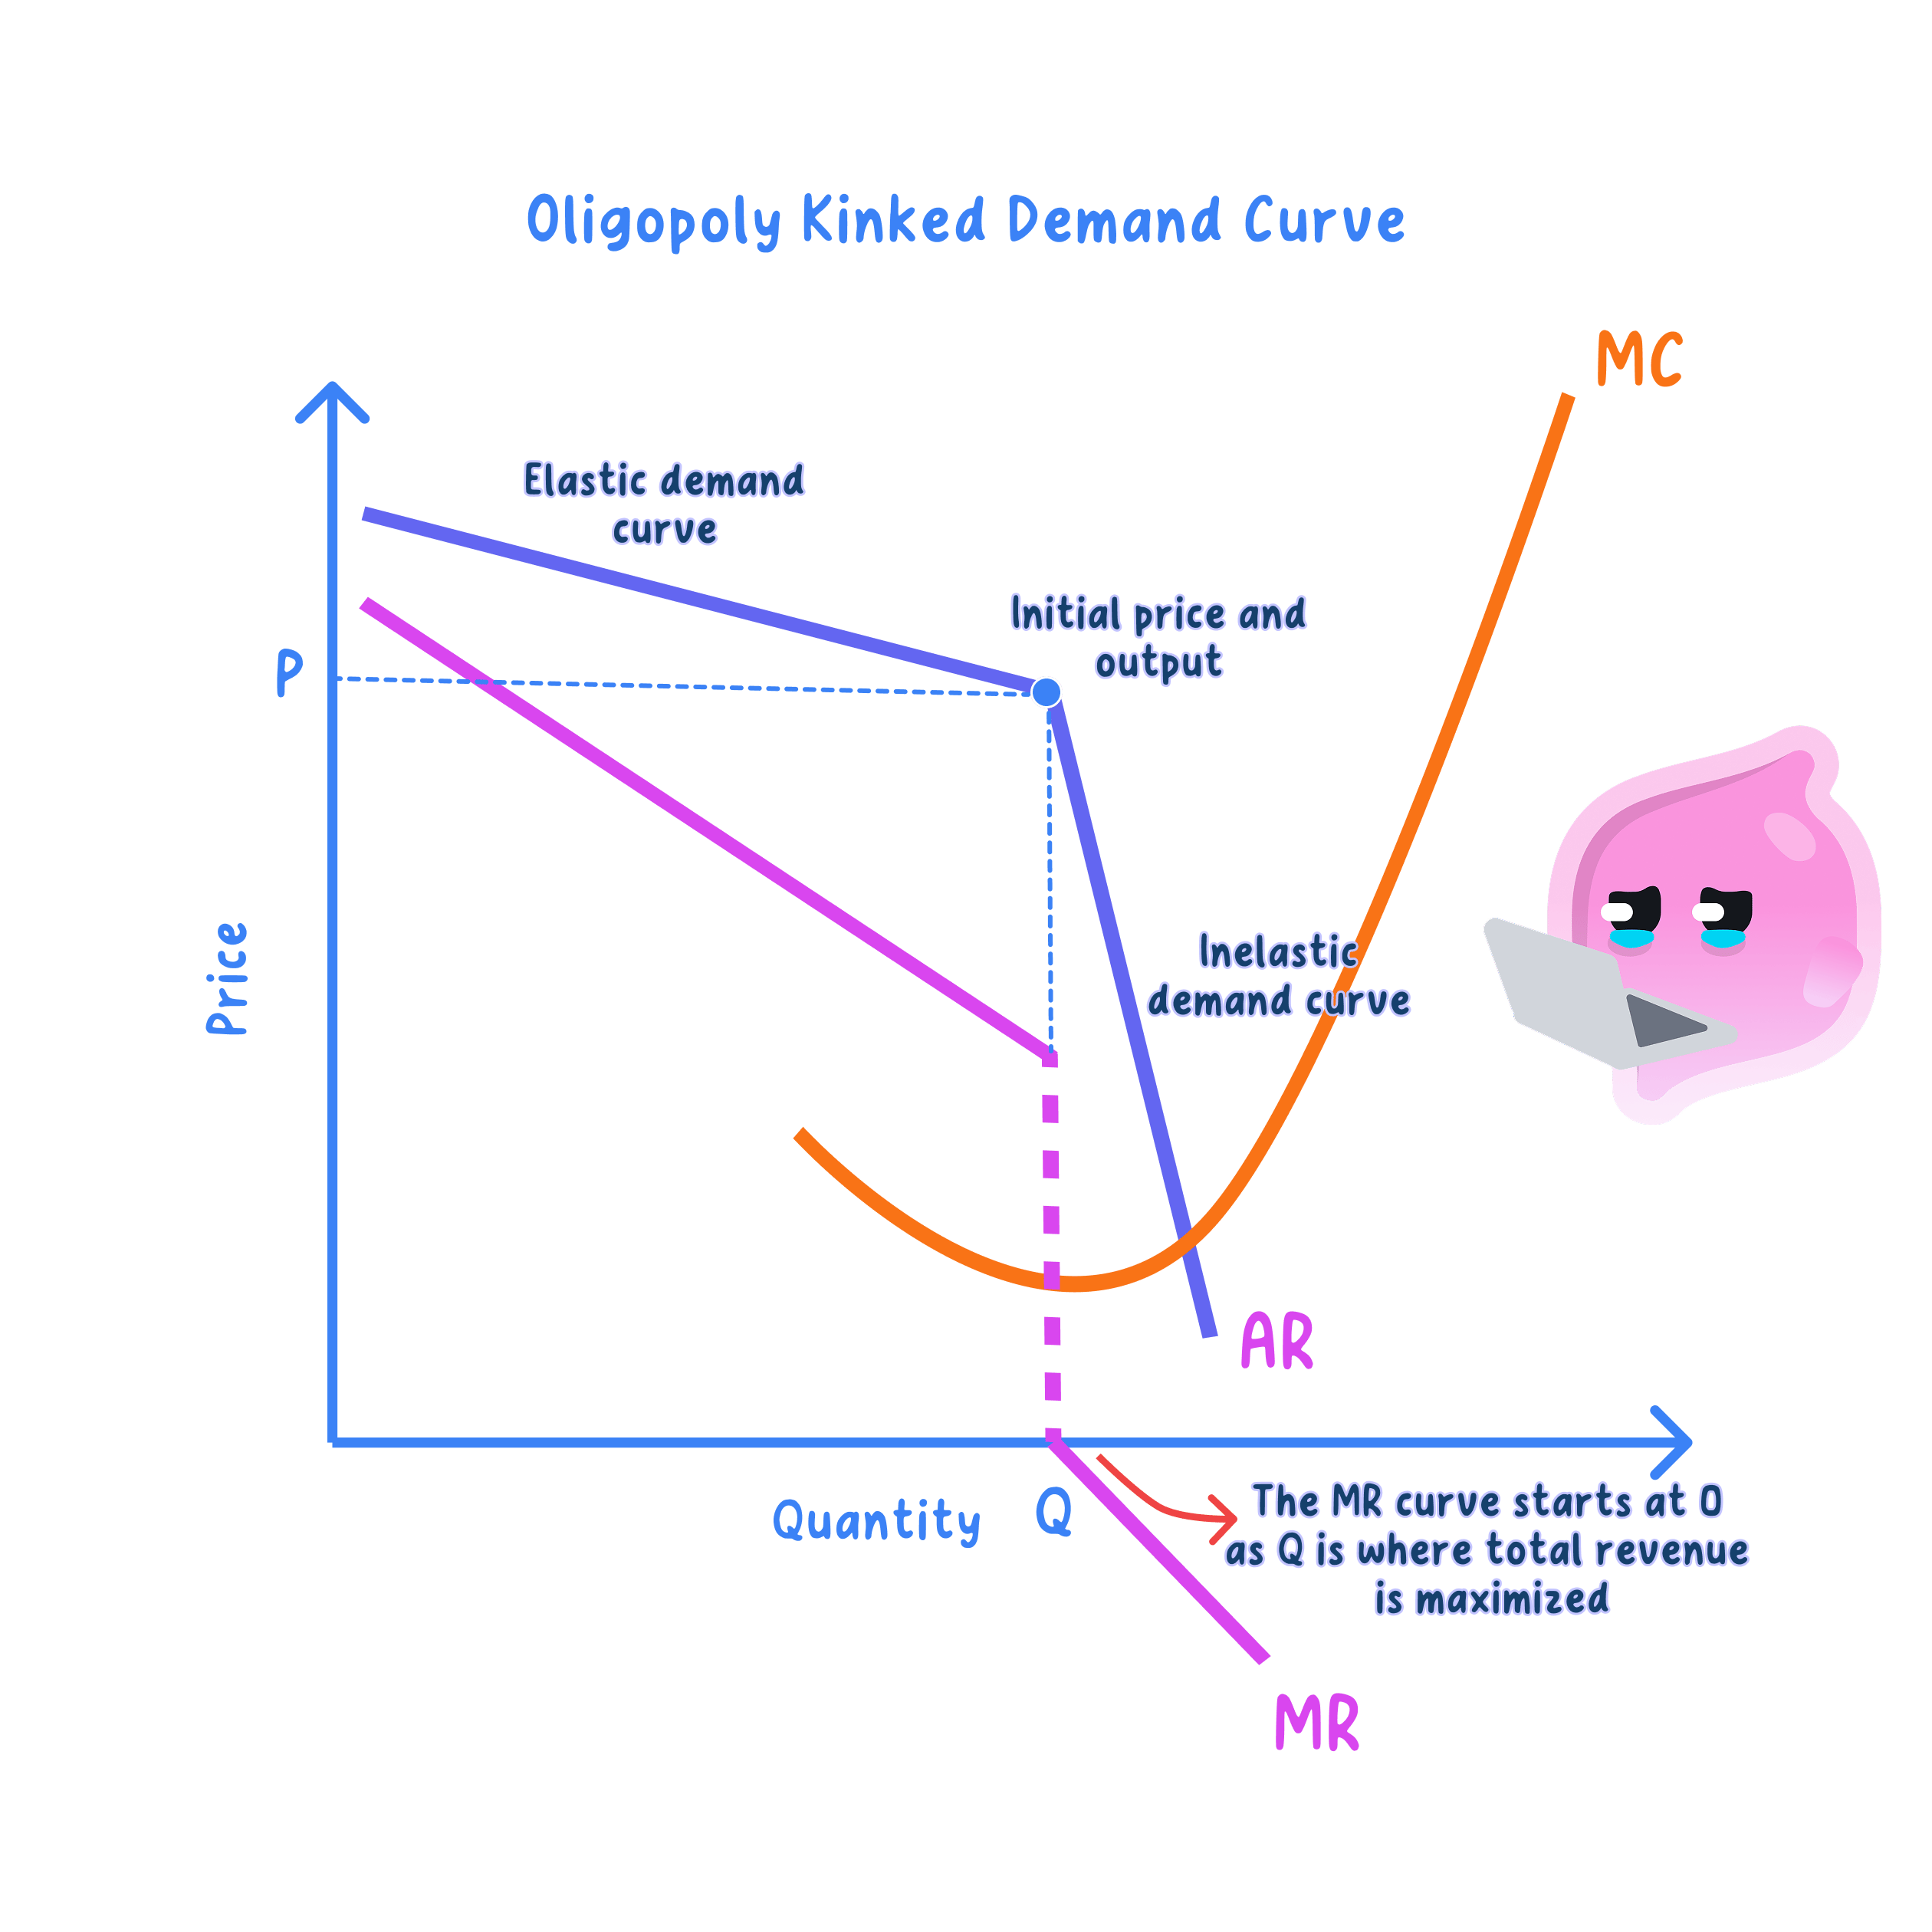
- The demand curve kinks at the current price P: it is flatter (more elastic) above P, because a price rise is not matched, so the firm loses many sales.
- It is steeper (more inelastic) below P, because a price cut is matched by rivals, so the firm wins few extra sales.
- The kink creates a vertical gap in MR, so costs can change within that gap without altering the profit-maximising price, which is why oligopoly prices are often sticky.
- Supermarkets, mobile networks, commercial banks and airlines are usually organised as oligopolies.
- Each watches the others closely, so headline prices often move together or stay stable while competition runs through offers, loyalty cards and advertising.
Natural monopoly
Natural monopoly: a market where economies of scale are so large relative to demand that one firm supplies the whole output at a lower average cost than two or more firms could.
- Fixed and infrastructure costs are enormous, such as a national grid, a rail network or a water pipe system, so average cost keeps falling as output rises: the huge fixed cost is spread over ever more units.
- Long-run average cost is still falling across the whole range of market demand, so a single large firm can supply the entire market at a lower average cost than two or more smaller firms could.
- Competition would wastefully duplicate the fixed network, a second set of pipes or rails, pushing each firm back up its falling AC curve and raising costs for everyone.
- Because it is still a monopoly, left unregulated it would restrict output and charge a high price, so natural monopolies are usually regulated by a price cap or run in public ownership; this intervention is developed in Themes 3 and 8.
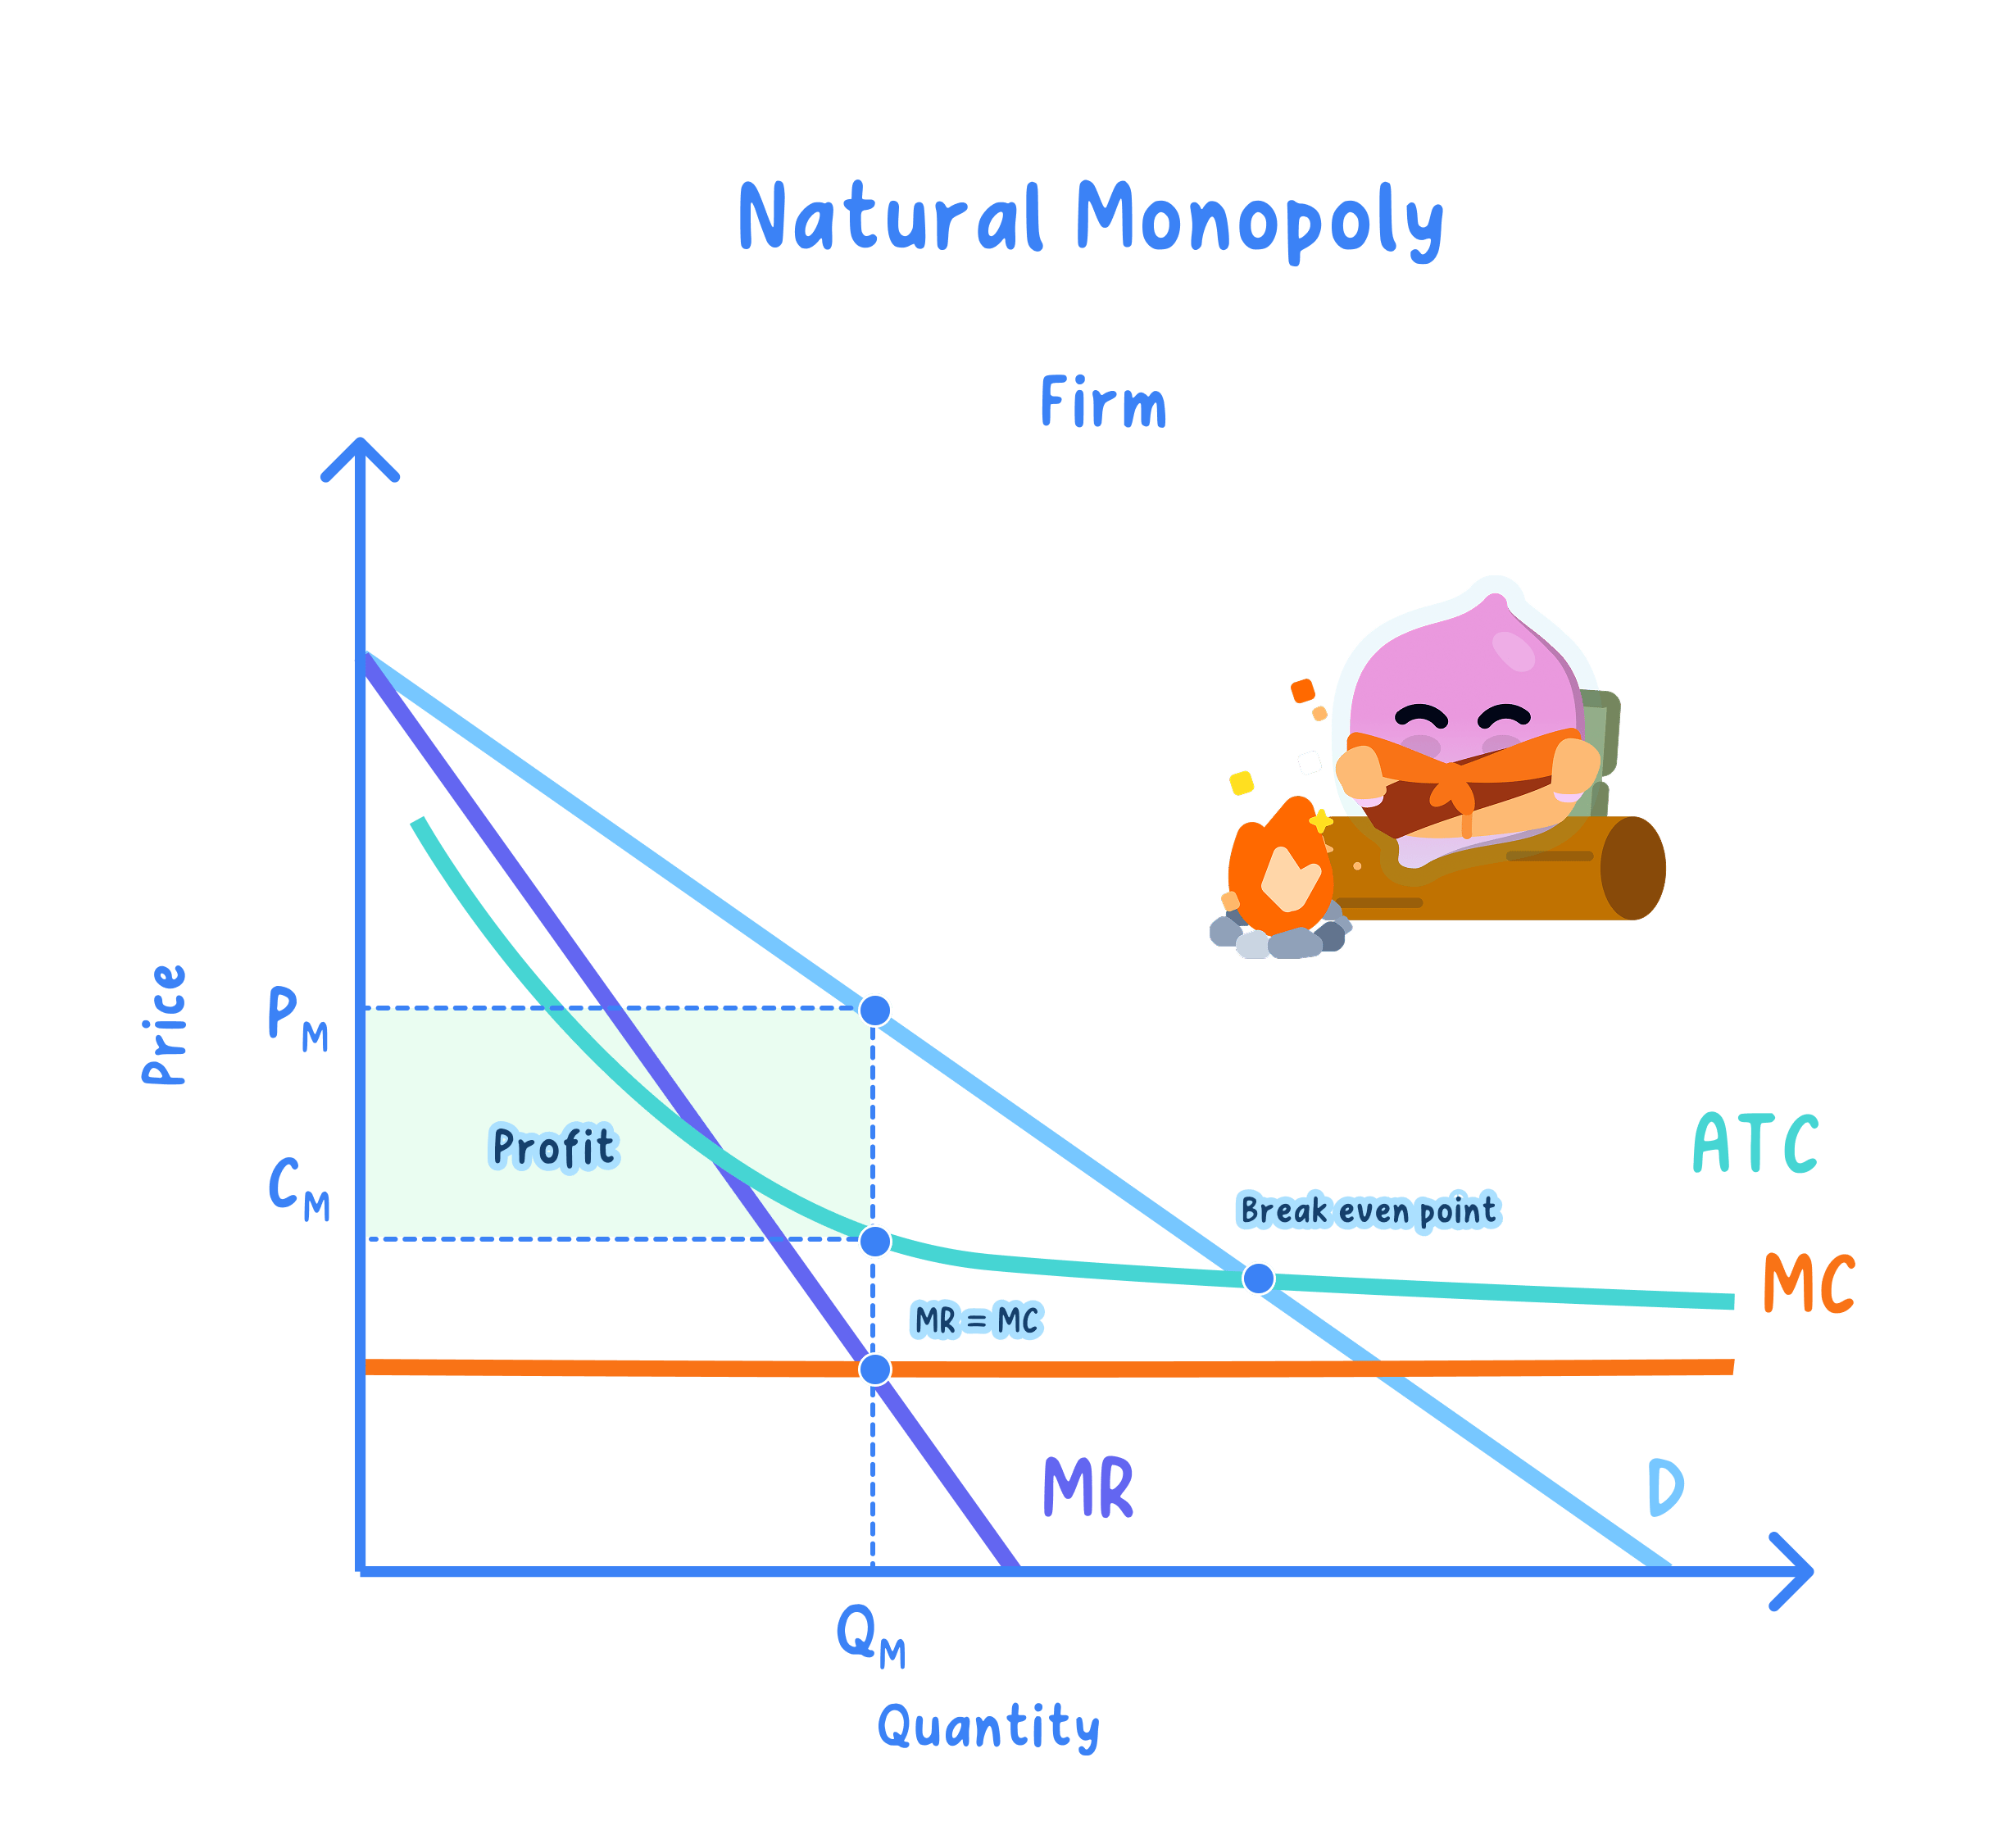
- LRAC falls across the entire relevant range, so bigger is cheaper per unit throughout, and marginal cost lies below average cost, which is why AC is still falling.
- Utilities such as water, rail track, the electricity grid and gas pipes are the classic examples, which is why they are usually regulated rather than opened to full competition.
How well do real markets fit these models?
- The four structures are useful benchmarks, because classifying a market by its number of firms, differentiation, barriers and information predicts whether firms are price takers or price makers and how much profit survives in the long run.
- But few real markets match a model exactly: perfect competition is almost never observed, and many markets sit between the pure cases, showing features of both monopolistic competition and oligopoly.
- The models are also largely static, so they can understate contestability and dynamic change: a market that looks like a monopoly may still be disciplined by the threat of entry or by new technology.
- On balance, the models remain a valuable starting point, but it depends on the market, so they are best used as a guide to likely behaviour rather than a precise label, judging each real market on how closely its four characteristics fit.
Is more competition always better?
- More competition usually helps consumers: with many rivals, price is driven down towards marginal cost, improving allocative efficiency, and firms are pushed to the lowest point of average cost and cannot afford X-inefficiency, so productive efficiency rises and prices fall.
- But very atomistic competition can be worse in some settings, because many tiny firms each produce a small output and stay high on the long-run average cost curve, forgoing economies of scale, and free entry competes profit down to normal, leaving little supernormal profit to fund research and development, so dynamic efficiency may suffer.
- In a natural monopoly more competition is clearly harmful, because duplicating a pipe or rail network pushes each firm back up its falling average cost curve, so one large firm supplies at a lower cost per unit than several rivals could.
- Contestability also matters, because even a single firm may keep price near cost and stay efficient if entry and exit are cheap, since the threat of new entrants disciplines its behaviour; how easily rivals could join can matter more than how many compete today.
- On balance, more competition is usually better for price and efficiency in ordinary many-firm consumer markets, but it depends on the industry, the size of the economies of scale available and how contestable the market is; where scale economies are very large, as in a natural monopoly, a single large but regulated firm can serve consumers more cheaply than fragmented competition.
- Classify a market by the four features: number and size of firms, product differentiation, barriers to entry and information.
- State clearly whether the firms are price takers or price makers, and draw the matching demand curve: horizontal for perfect competition, downward sloping for a price maker, kinked for an oligopoly.
- Label diagrams fully with AR, MR, MC and AC, the profit-maximising output at MC = MR, and any supernormal profit area.
- Do not treat monopolistic competition and oligopoly as the same: monopolistic competition has many independent firms, while oligopoly has a few interdependent ones.
- Do not say a monopoly charges the highest possible price; it maximises profit at MC = MR, not at the top of the demand curve.
- Do not confuse a natural monopoly, where average cost falls across the whole market, with an ordinary monopoly.
- What are the four features used to classify market structures?
- Why is a perfectly competitive firm a price taker facing P = AR = MR?
- Define a pure monopoly and explain why P > MC there.
- How does monopolistic competition differ from oligopoly?
- Why do oligopoly prices tend to be stable?
- What causes a natural monopoly, and why is competition wasteful there?
- In which structures is only normal profit earned in the long run?
