Measuring income inequality
- Income distribution describes how a country's income is shared across its population.
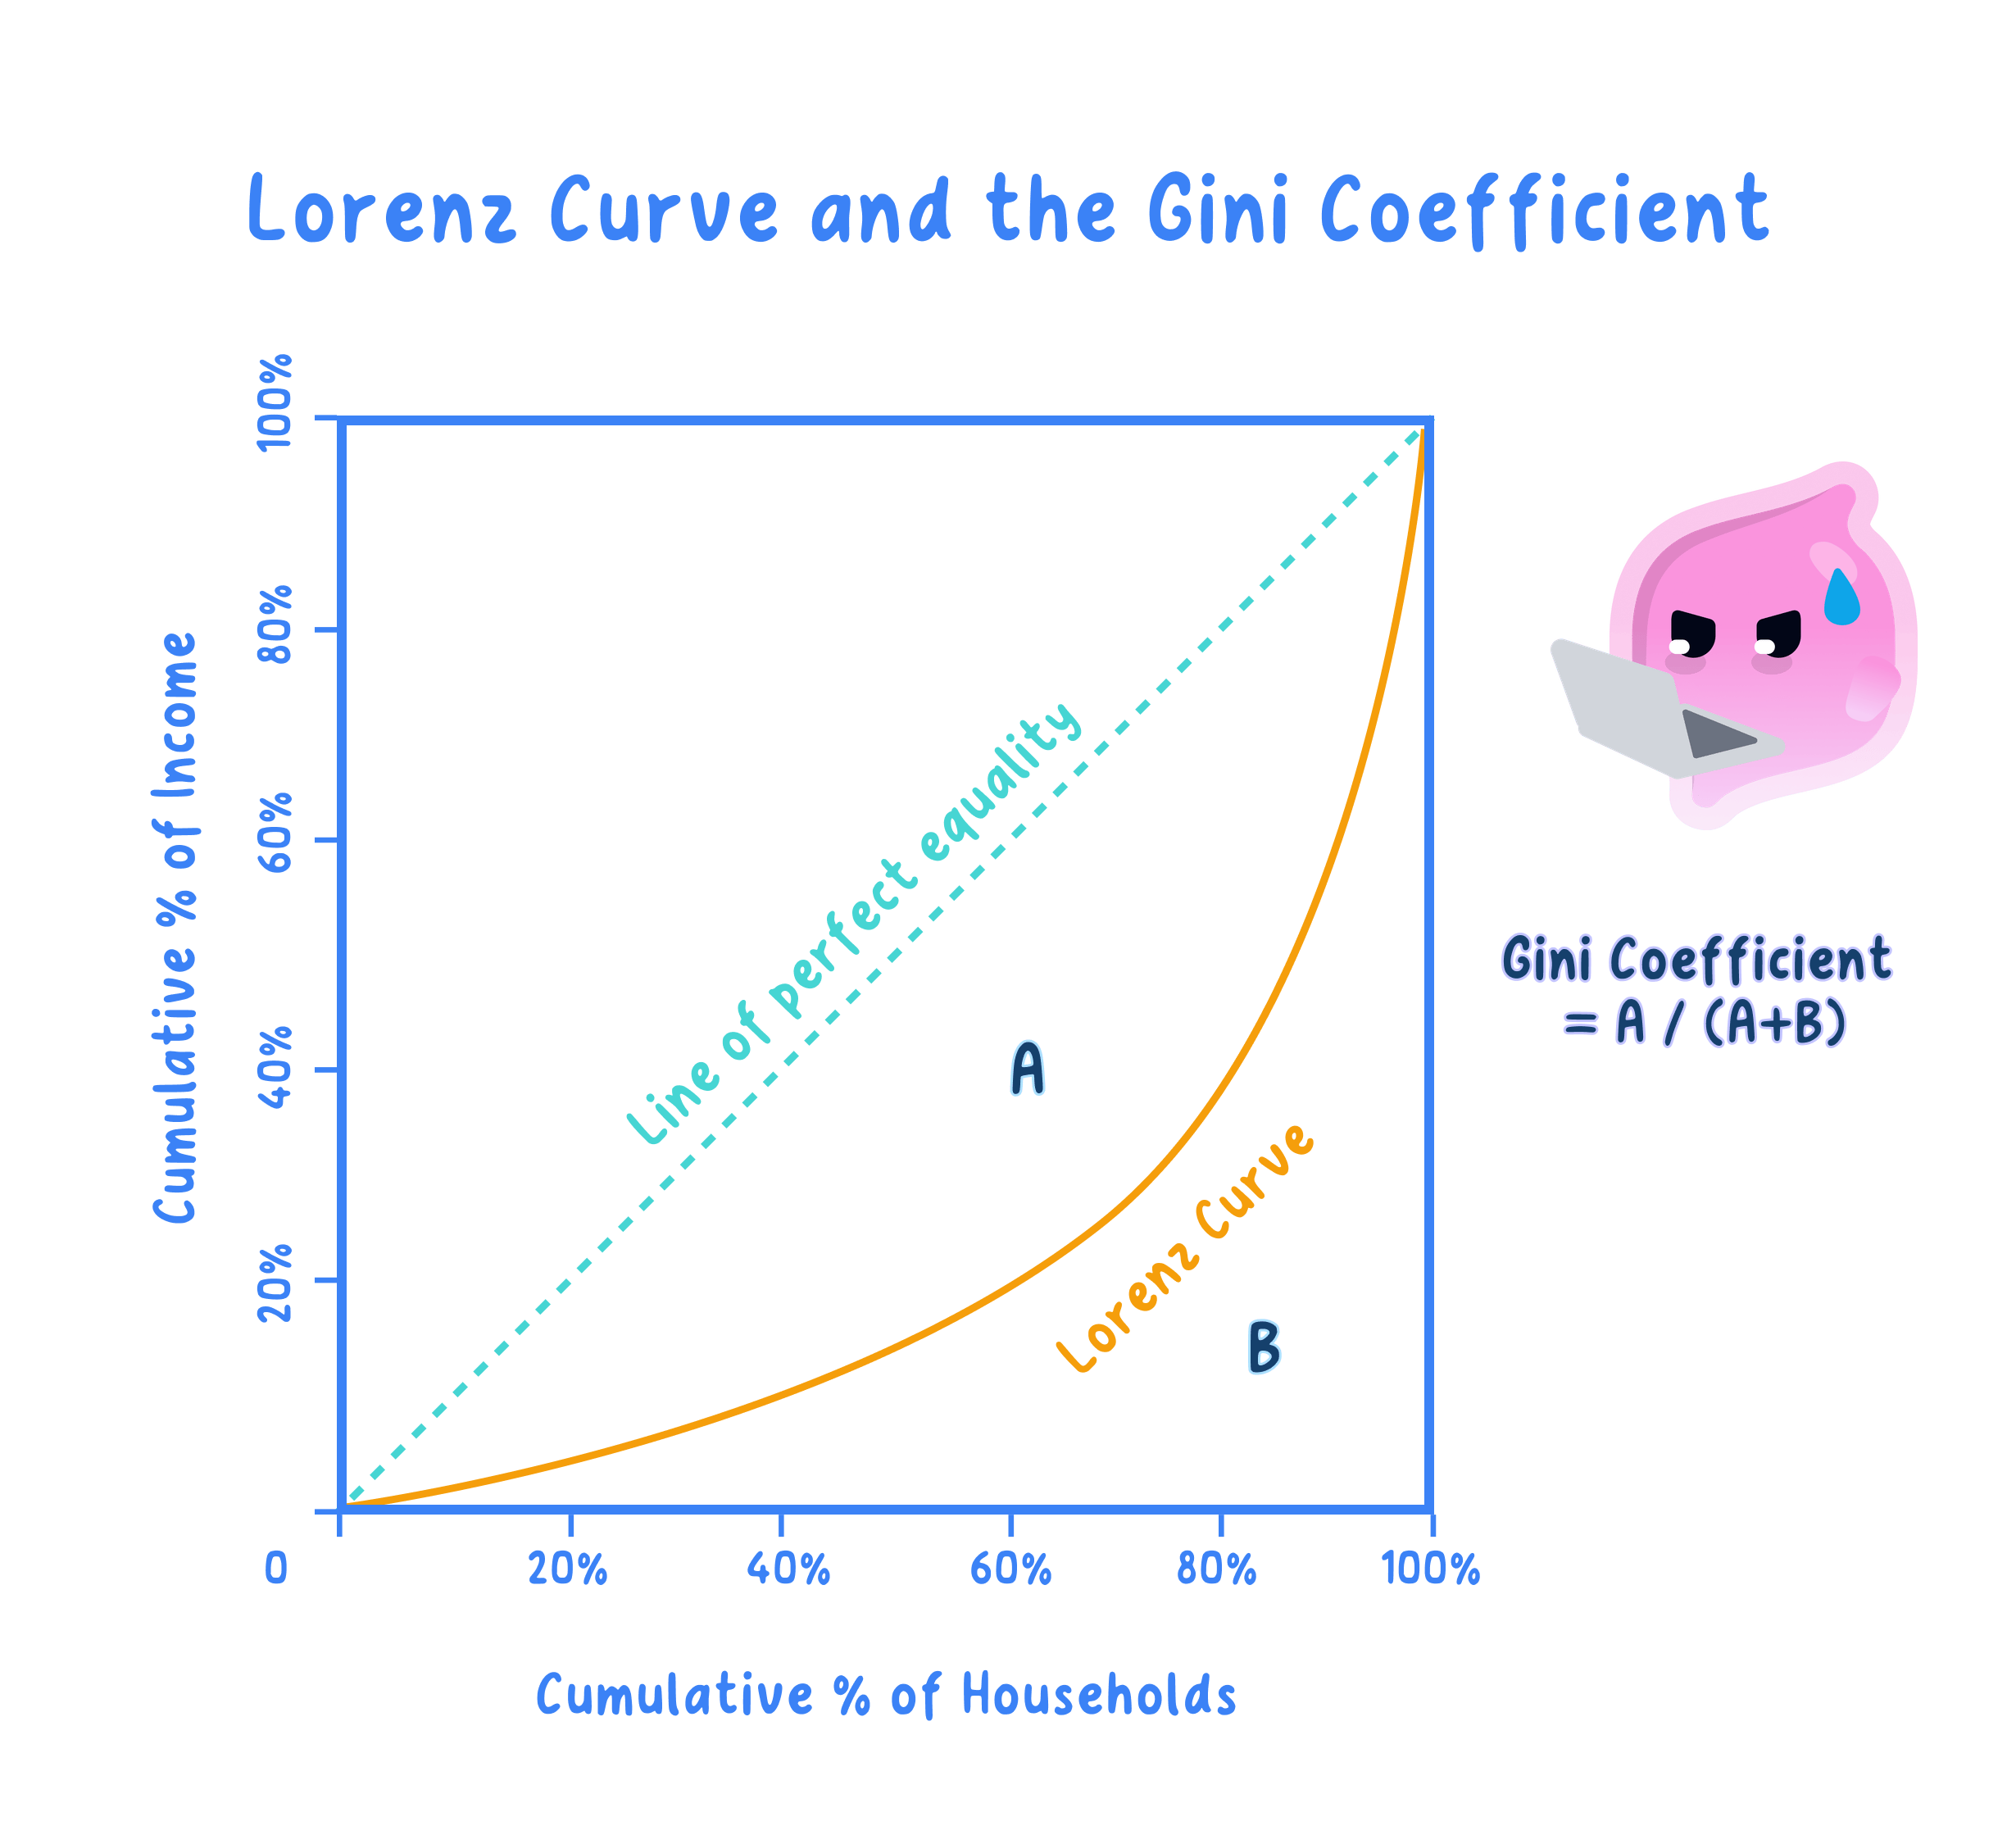
- The Lorenz curve shows the distribution graphically.
- The Gini coefficient turns that picture into a single number.
Key Idea
- The further the Lorenz curve bows away from the line of equality, the more unequal the distribution.
- The Gini coefficient ranges from 0 for perfect equality to 1 for perfect inequality.
The Lorenz curve
Definition
Lorenz curve: a graph plotting the cumulative % of income received against the cumulative % of the population, ranked poorest to richest.
Line of equality: the 45-degree diagonal along which each share of the population receives an equal share of income.
- The horizontal axis shows the cumulative % of the population, ranked from poorest to richest.
- The vertical axis shows the cumulative % of income that group receives.
- The actual distribution sags below the diagonal because the poorest fifth of people receive less than a fifth of income.
- The further the curve bows away from the diagonal, the more unequal the distribution.
Example
- Suppose the poorest 50% of people receive only 20% of income; the curve passes through that point well below the diagonal.
- A curve closer to the diagonal, where the poorest 50% receive nearer 50%, shows a more equal society.
The Gini coefficient
Definition
Gini coefficient: the ratio of the area between the line of equality and the Lorenz curve to the whole area beneath the line of equality.
Gini coefficient = A ÷ (A + B)
- Area A is the gap between the line of equality and the Lorenz curve, which widens as inequality rises.
- Area B is the area below the Lorenz curve; A + B is the whole triangle beneath the diagonal.
- The coefficient lies between 0 and 1, and is sometimes multiplied by 100 to give a Gini index.
Example
- Suppose the poorest 50% receive 20% of income, giving area A of 0.30 units and area B of 0.20 units below the diagonal.
- A Gini of 0.6 is high; the closer to 1, the more income is concentrated among the rich.
Interpreting the measures
- A higher Gini coefficient means a more unequal distribution of income.
- The measures allow inequality to be compared over time and between countries on a common scale.
- Two countries can share a Gini value yet have differently shaped Lorenz curves, so the single number can hide where inequality lies.
- Inequality looks smaller after taxes and benefits than before, so it matters which income is measured.
Note
- Whether a given Gini is a problem depends on why inequality exists and whether it traps people in poverty.
- Progressive taxes and transfer payments lower the after-tax Gini by redistributing income to poorer households.
Exam technique
- Draw the Lorenz curve with both axes as cumulative percentages and label the line of equality.
- State the Gini formula as A ÷ (A + B) and interpret the number you obtain.
- Note whether the data is measured before or after taxes and benefits.
Common Mistake
- Do not put income on the horizontal axis, since population is cumulated there.
- Do not read a lower Gini coefficient as higher inequality.
Self review
- What do the two axes of a Lorenz curve show?
- State the formula for the Gini coefficient.
- If area A is 0.25 and area B is 0.25, what is the Gini coefficient?
- What does a Gini coefficient of 0 represent?
- Give one limitation of the Gini coefficient.
