Deriving the demand curve
Definition
Individual demand curve: a curve showing the quantity of a good a single consumer will buy at each price.
Marginal utility of money: the extra satisfaction gained from the last £ of income, used to value goods in money terms.
The chain runs from falling marginal utility to a falling price the buyer will pay, and that is exactly what the curve plots.
From utility to demand
- A consumer buys a unit while its marginal utility is at least worth the price.
- As more is bought, marginal utility falls, by diminishing marginal utility.
- So a lower price is needed to justify buying each further unit.
- By the equi-marginal result, a price fall raises MU ÷ P above the marginal utility of money, so the consumer buys more until balance returns.
- Tracing the price a buyer will pay against quantity gives a downward-sloping demand curve.
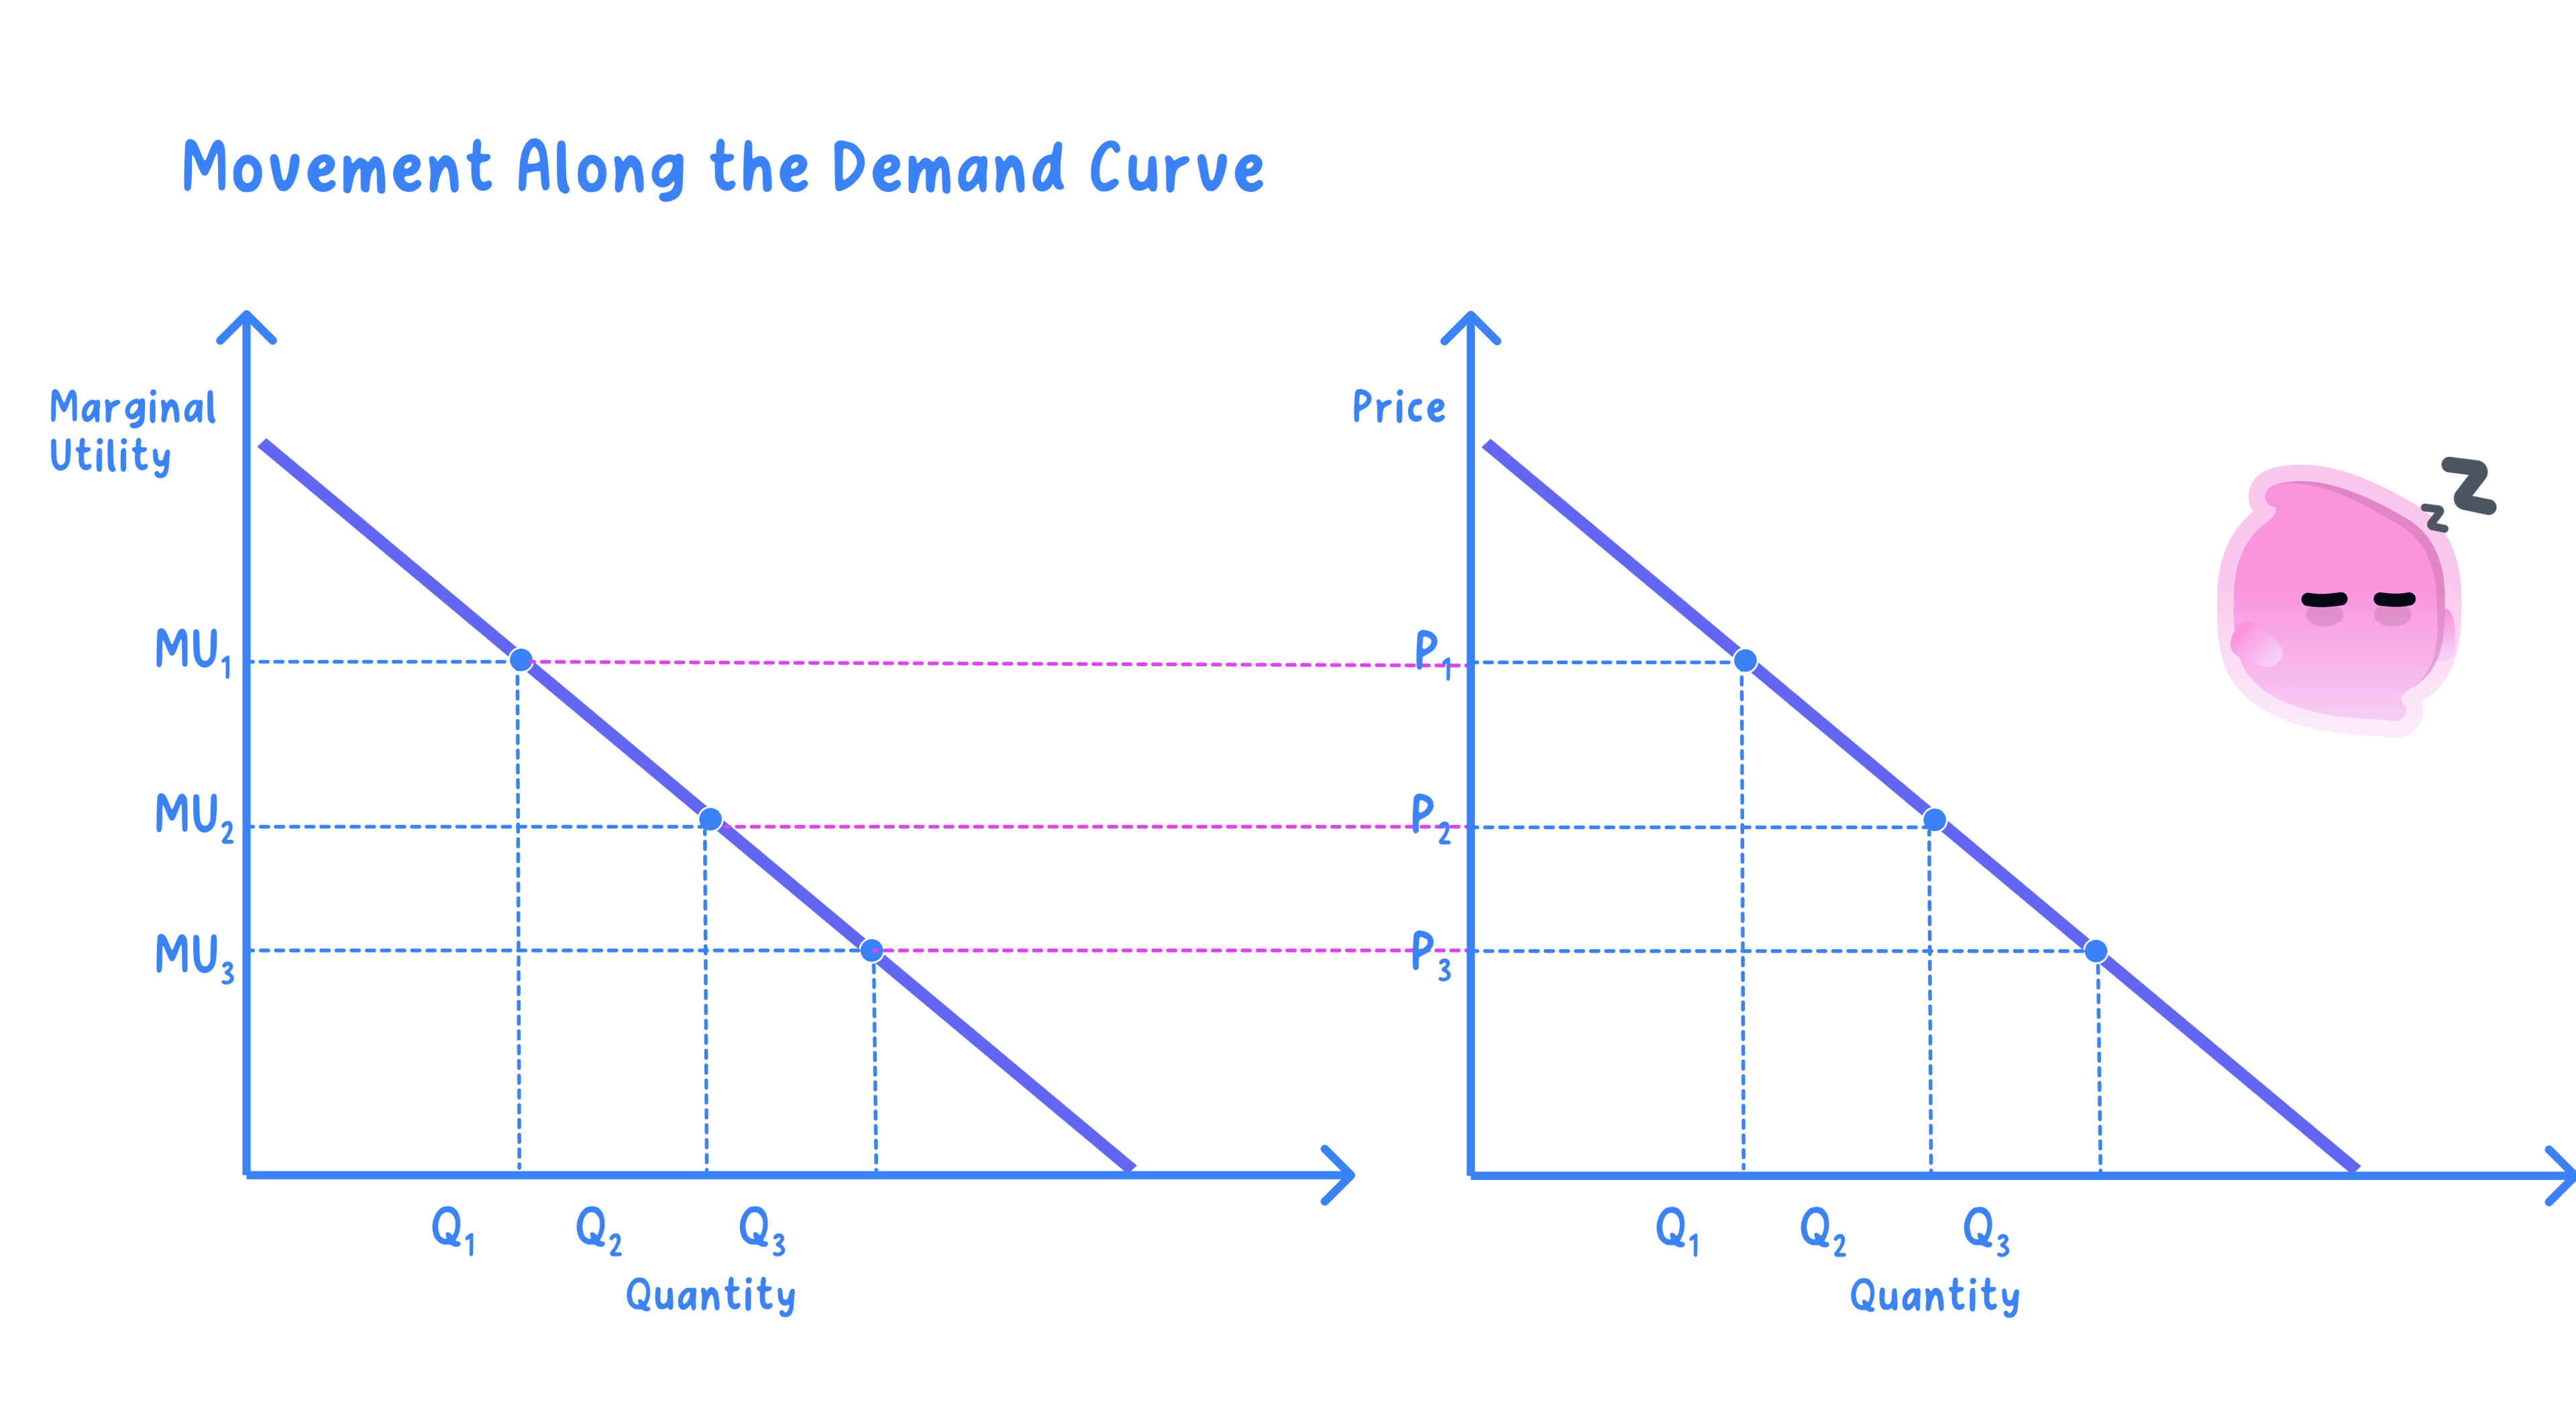
Example
- Marginal utility from units 1 to 4 is 40, 30, 20 and 10 utils, and each £1 is worth 10 utils to the consumer.
- A unit is bought while its marginal utility is at least price × 10, the utility of £1 of income.
- A lower price (£4 → £2) raises quantity demanded (1 → 3), tracing a downward-sloping demand curve.
Reading the demand curve
- Price is on the vertical axis and quantity on the horizontal axis.
- The curve slopes down from left to right.
- Each point shows the maximum price a buyer will pay for that unit.
- That price reflects the unit's marginal utility, so the curve is the marginal utility schedule in money form.
Note
- A buyer pays a high price for the first unit they value most.
- They buy extra units only when the price drops.
- So the marginal utility schedule maps onto the demand curve.
More than one explanation
- Diminishing marginal utility is one explanation for the downward slope.
- The income effect, where a lower price raises real income, and the substitution effect, where the good is now relatively cheaper, also raise quantity demanded (further explained in 7.2).
- The explanations reinforce one another rather than compete.
- Which channel dominates depends on the good; for a normal good all three pull the same way.
Exam technique
- Explain that falling marginal utility lowers the price a buyer will pay.
- Map the marginal utility schedule onto the demand curve.
- Mention the income and substitution effects as well.
Common Mistake
- Do not attribute the downward slope solely to income and substitution effects.
- The marginal-utility explanation matters too.
Self review
- Why is each extra unit worth less to a buyer?
- Why will a consumer only buy more at a lower price?
- What is on each axis of the demand curve?
- How does the marginal utility schedule relate to demand?
- What other effects explain the downward slope?
