Shifts in the AD Curve
Definition
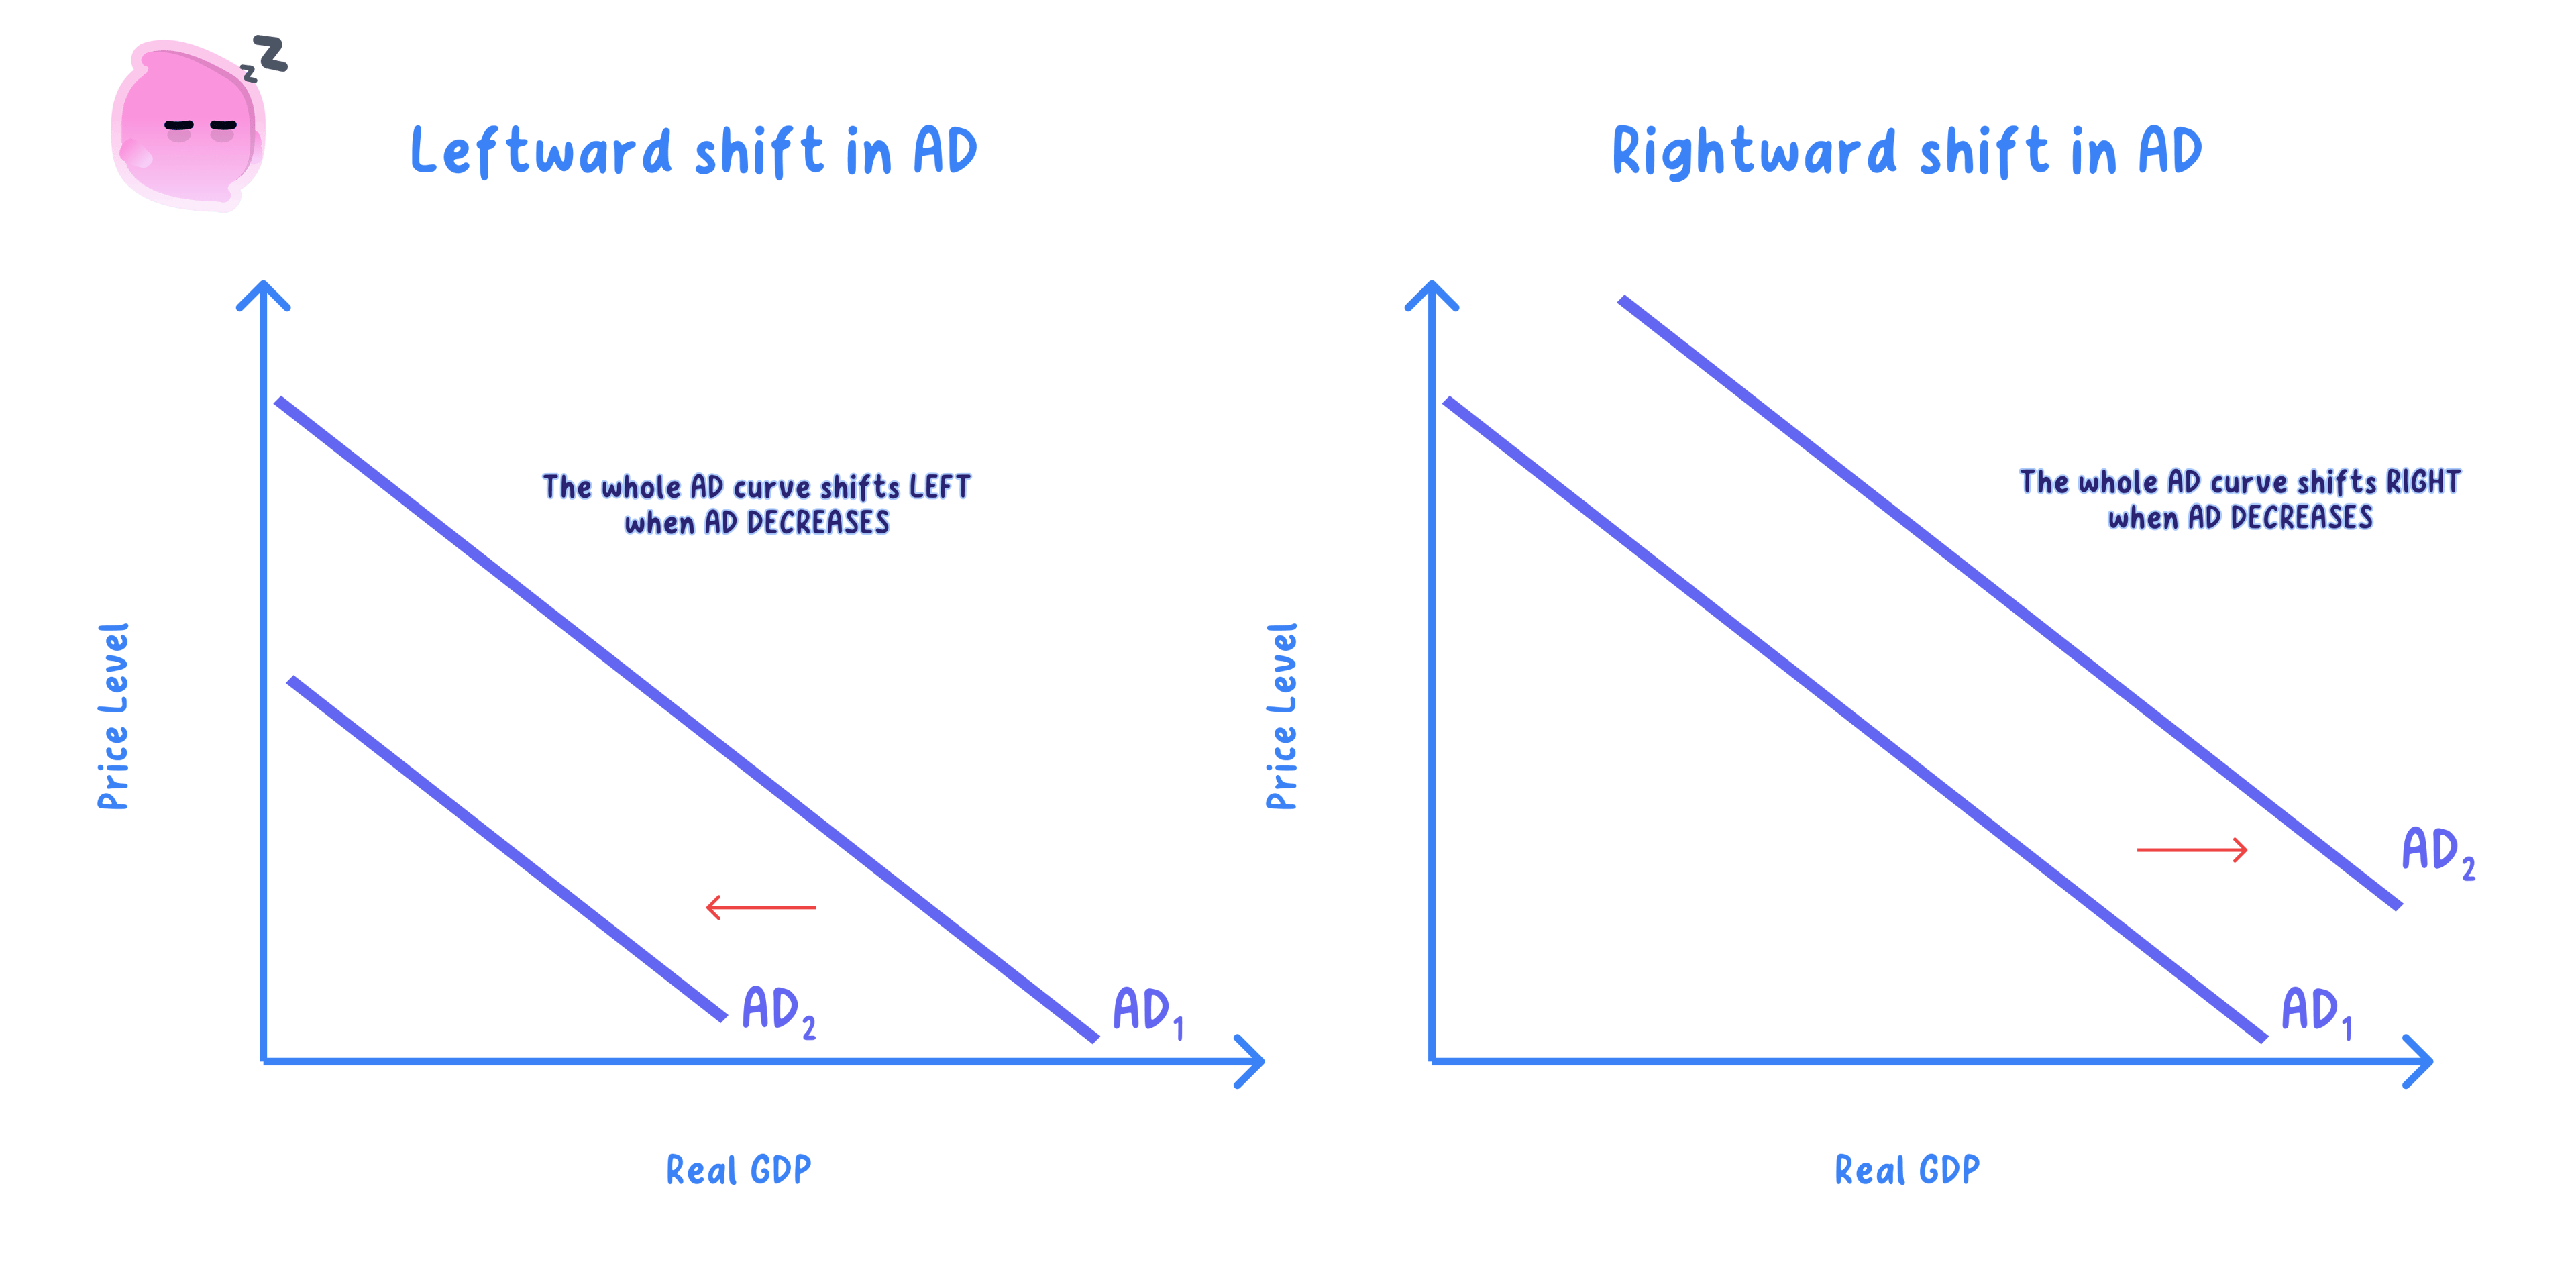
Shift in the AD curve: a change in planned spending at every price level, caused by a change in a component of AD rather than by the price level itself.
Direction of the Shift
- A rise in C, I, G or (X − M) shifts AD to the right, since AD = C + I + G + (X − M).
- A fall in C, I, G or (X − M) shifts AD to the left.
Key Idea
- Anything that raises planned spending at each price level shifts AD to the right.
- Anything that lowers planned spending at each price level shifts AD to the left.
Common Causes
- Confidence: optimistic firms invest more, raising I and shifting AD right.
- Interest rates: a cut lowers the cost of borrowing, raising C and I.
- Income and taxation: an income-tax cut raises disposable income and so C.
- The exchange rate: a weaker currency raises (X − M) by making exports cheaper and imports dearer.
- Conditions abroad: a recession in trading partners cuts foreign demand for exports X, shifting AD left.
- Fiscal policy: higher government spending raises G and shifts AD right directly.
Chain of Reasoning
- A cause changes one component of aggregate demand.
- Planned spending at every price level then rises or falls.
- So the whole AD curve shifts right or left.
Example
- Suppose a central bank cuts its policy rate from 4% to 3%.
- Repayments on a £200,000 mortgage fall, so households have more to consume, and firms' projects become more profitable.
- This raises the C and I components of AD.
- Planned spending rises at every price level, so AD shifts to the right.
Size of the Shift
- The larger the change in the component, the further AD shifts.
- A given rate cut shifts AD more when confidence is high and households actually borrow.
- In a deep recession, gloomy expectations can mute the shift even after a large cut.
Shift Versus Movement
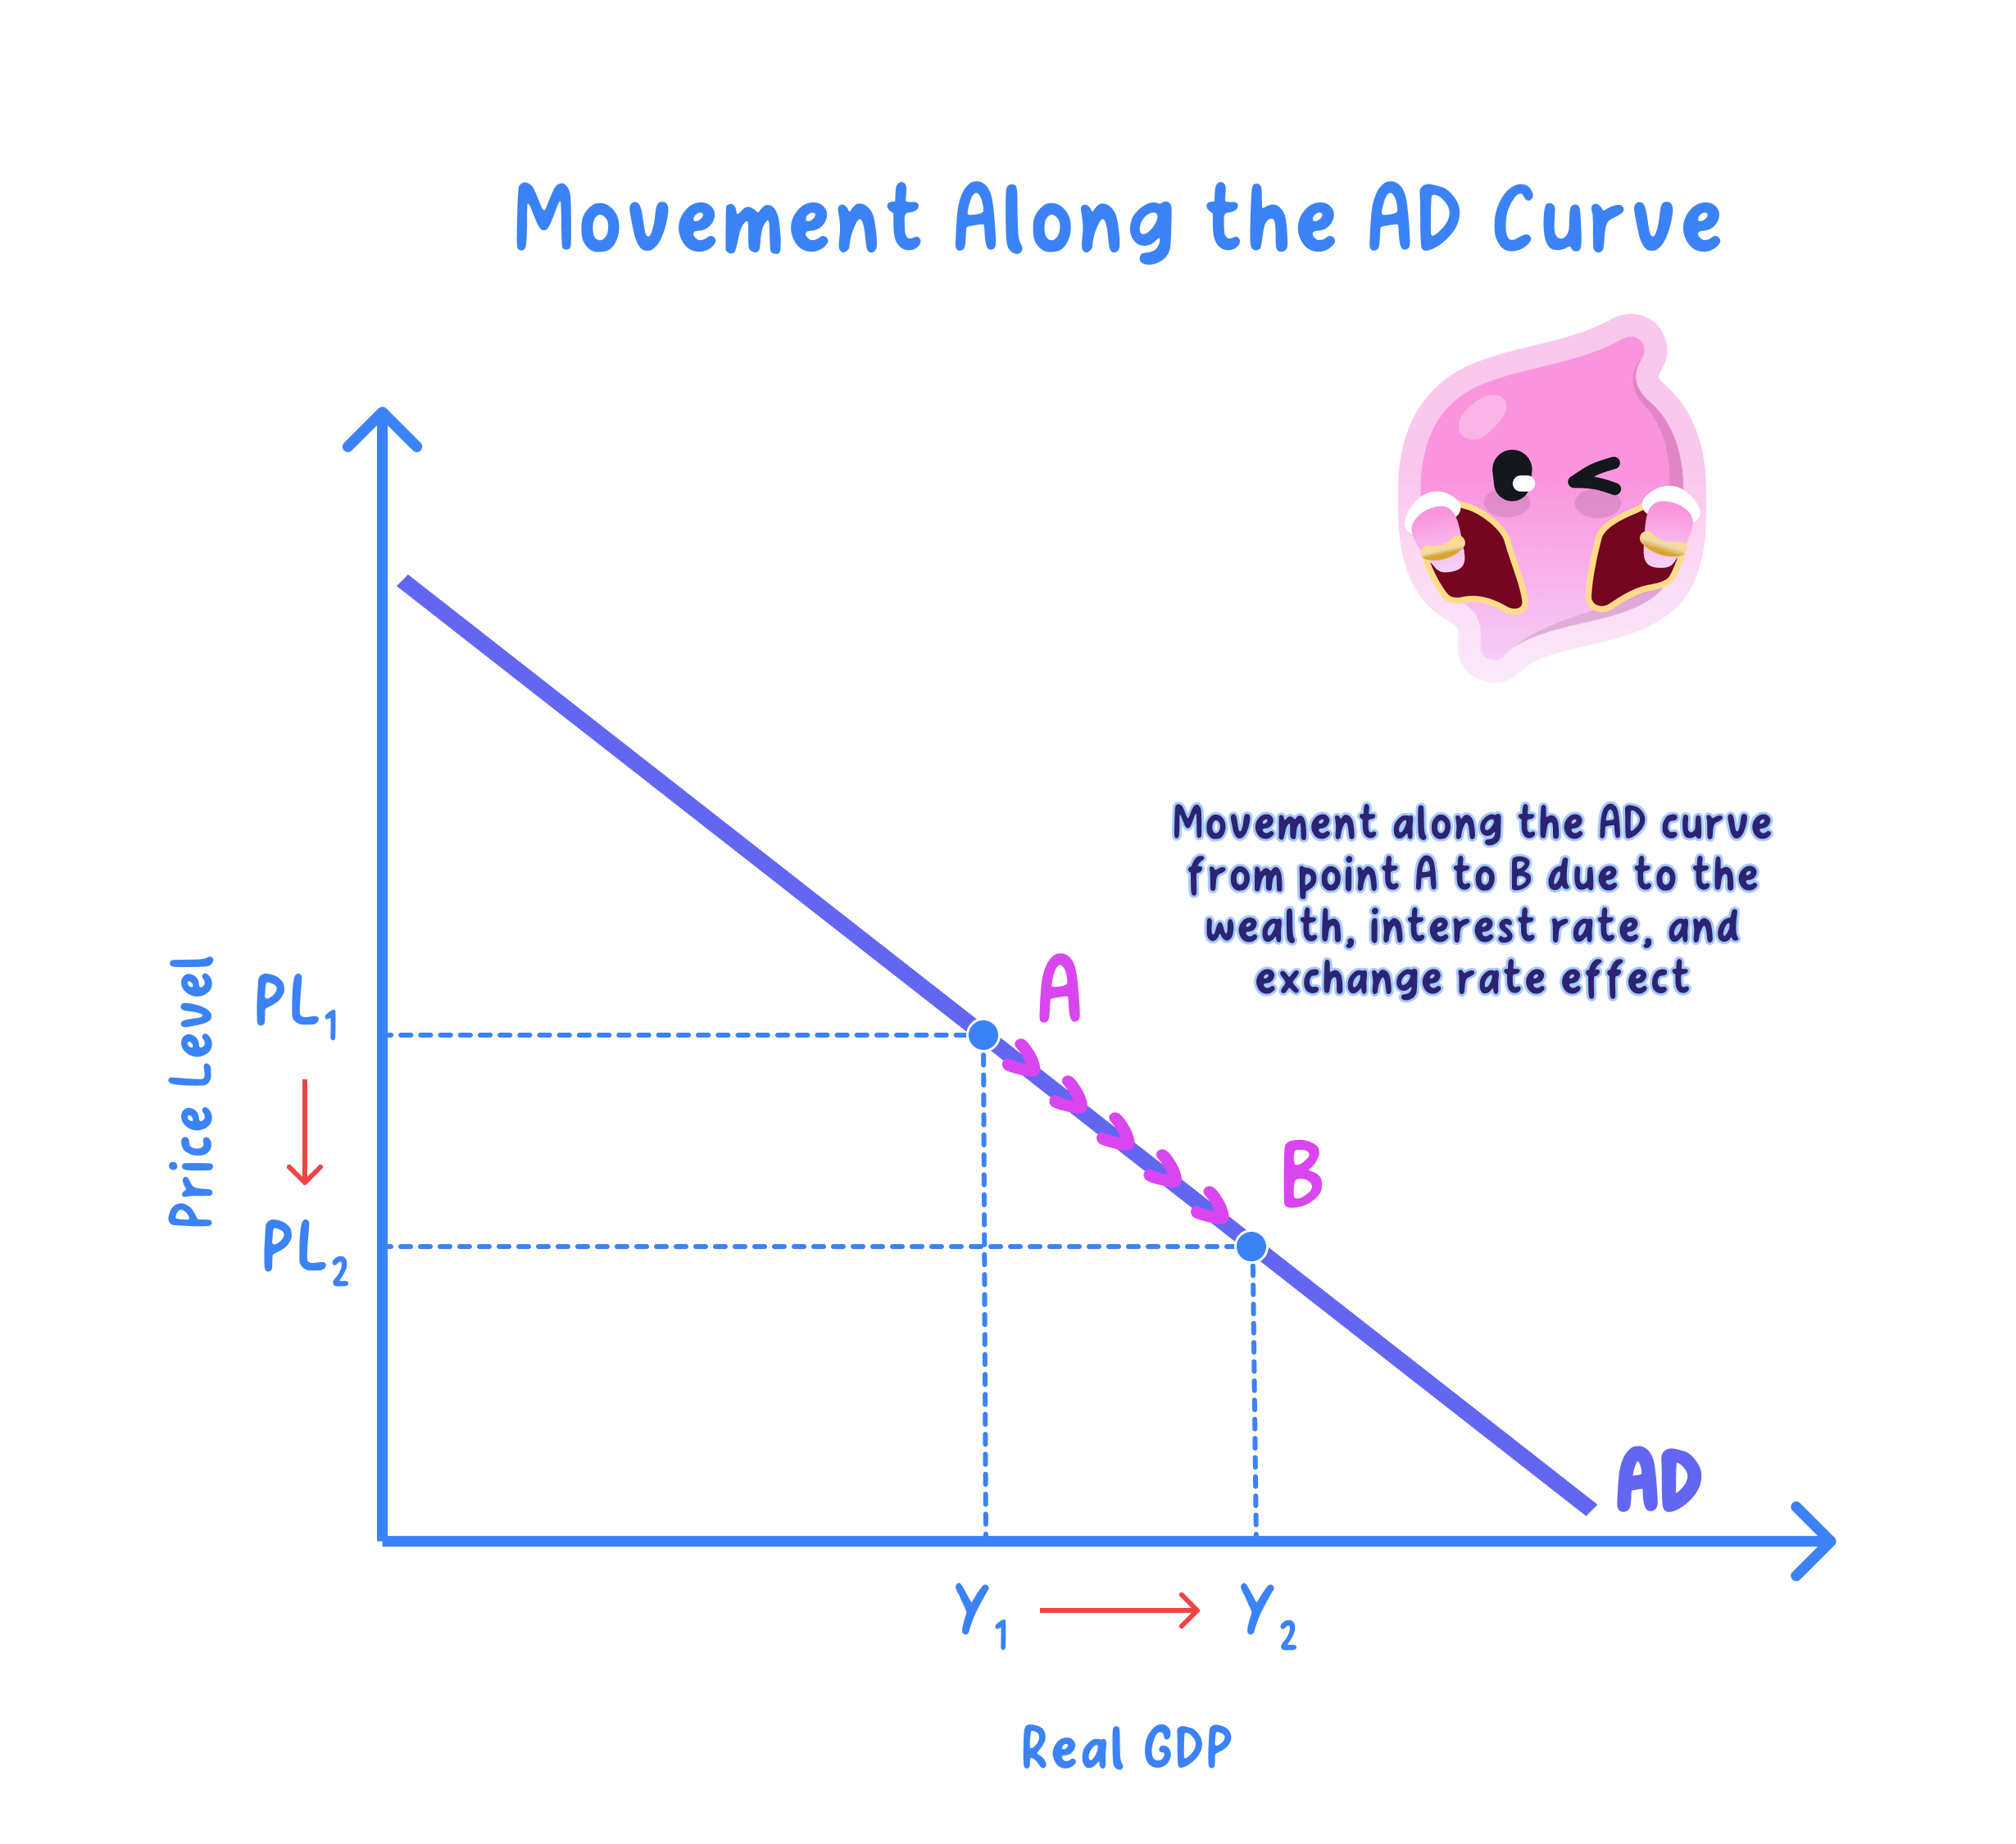
- A component change at a given price level moves the whole curve.
- A price-level change only moves the economy along the existing curve.
Exam technique
- Say which component changed and in which direction AD shifts.
- Label the vertical axis average price level and the horizontal axis real output.
Common Mistake
- Do not treat a price-level change as a shift of the curve.
- A price-level change is a movement along the curve, not a shift.
Self review
- What causes the AD curve to shift?
- Name three causes of a rightward shift in AD.
- What is the difference between a shift and a movement along AD?
- Why is a price-level change not a shift?
