AD/AS analysis of fiscal policy
Definition
Aggregate demand (AD): total planned spending on an economy's output at each price level, where AD = C + I + G + (X − M).
Equilibrium national income: the level of real output where AD equals AS, so total planned spending matches output.
Reading the diagram
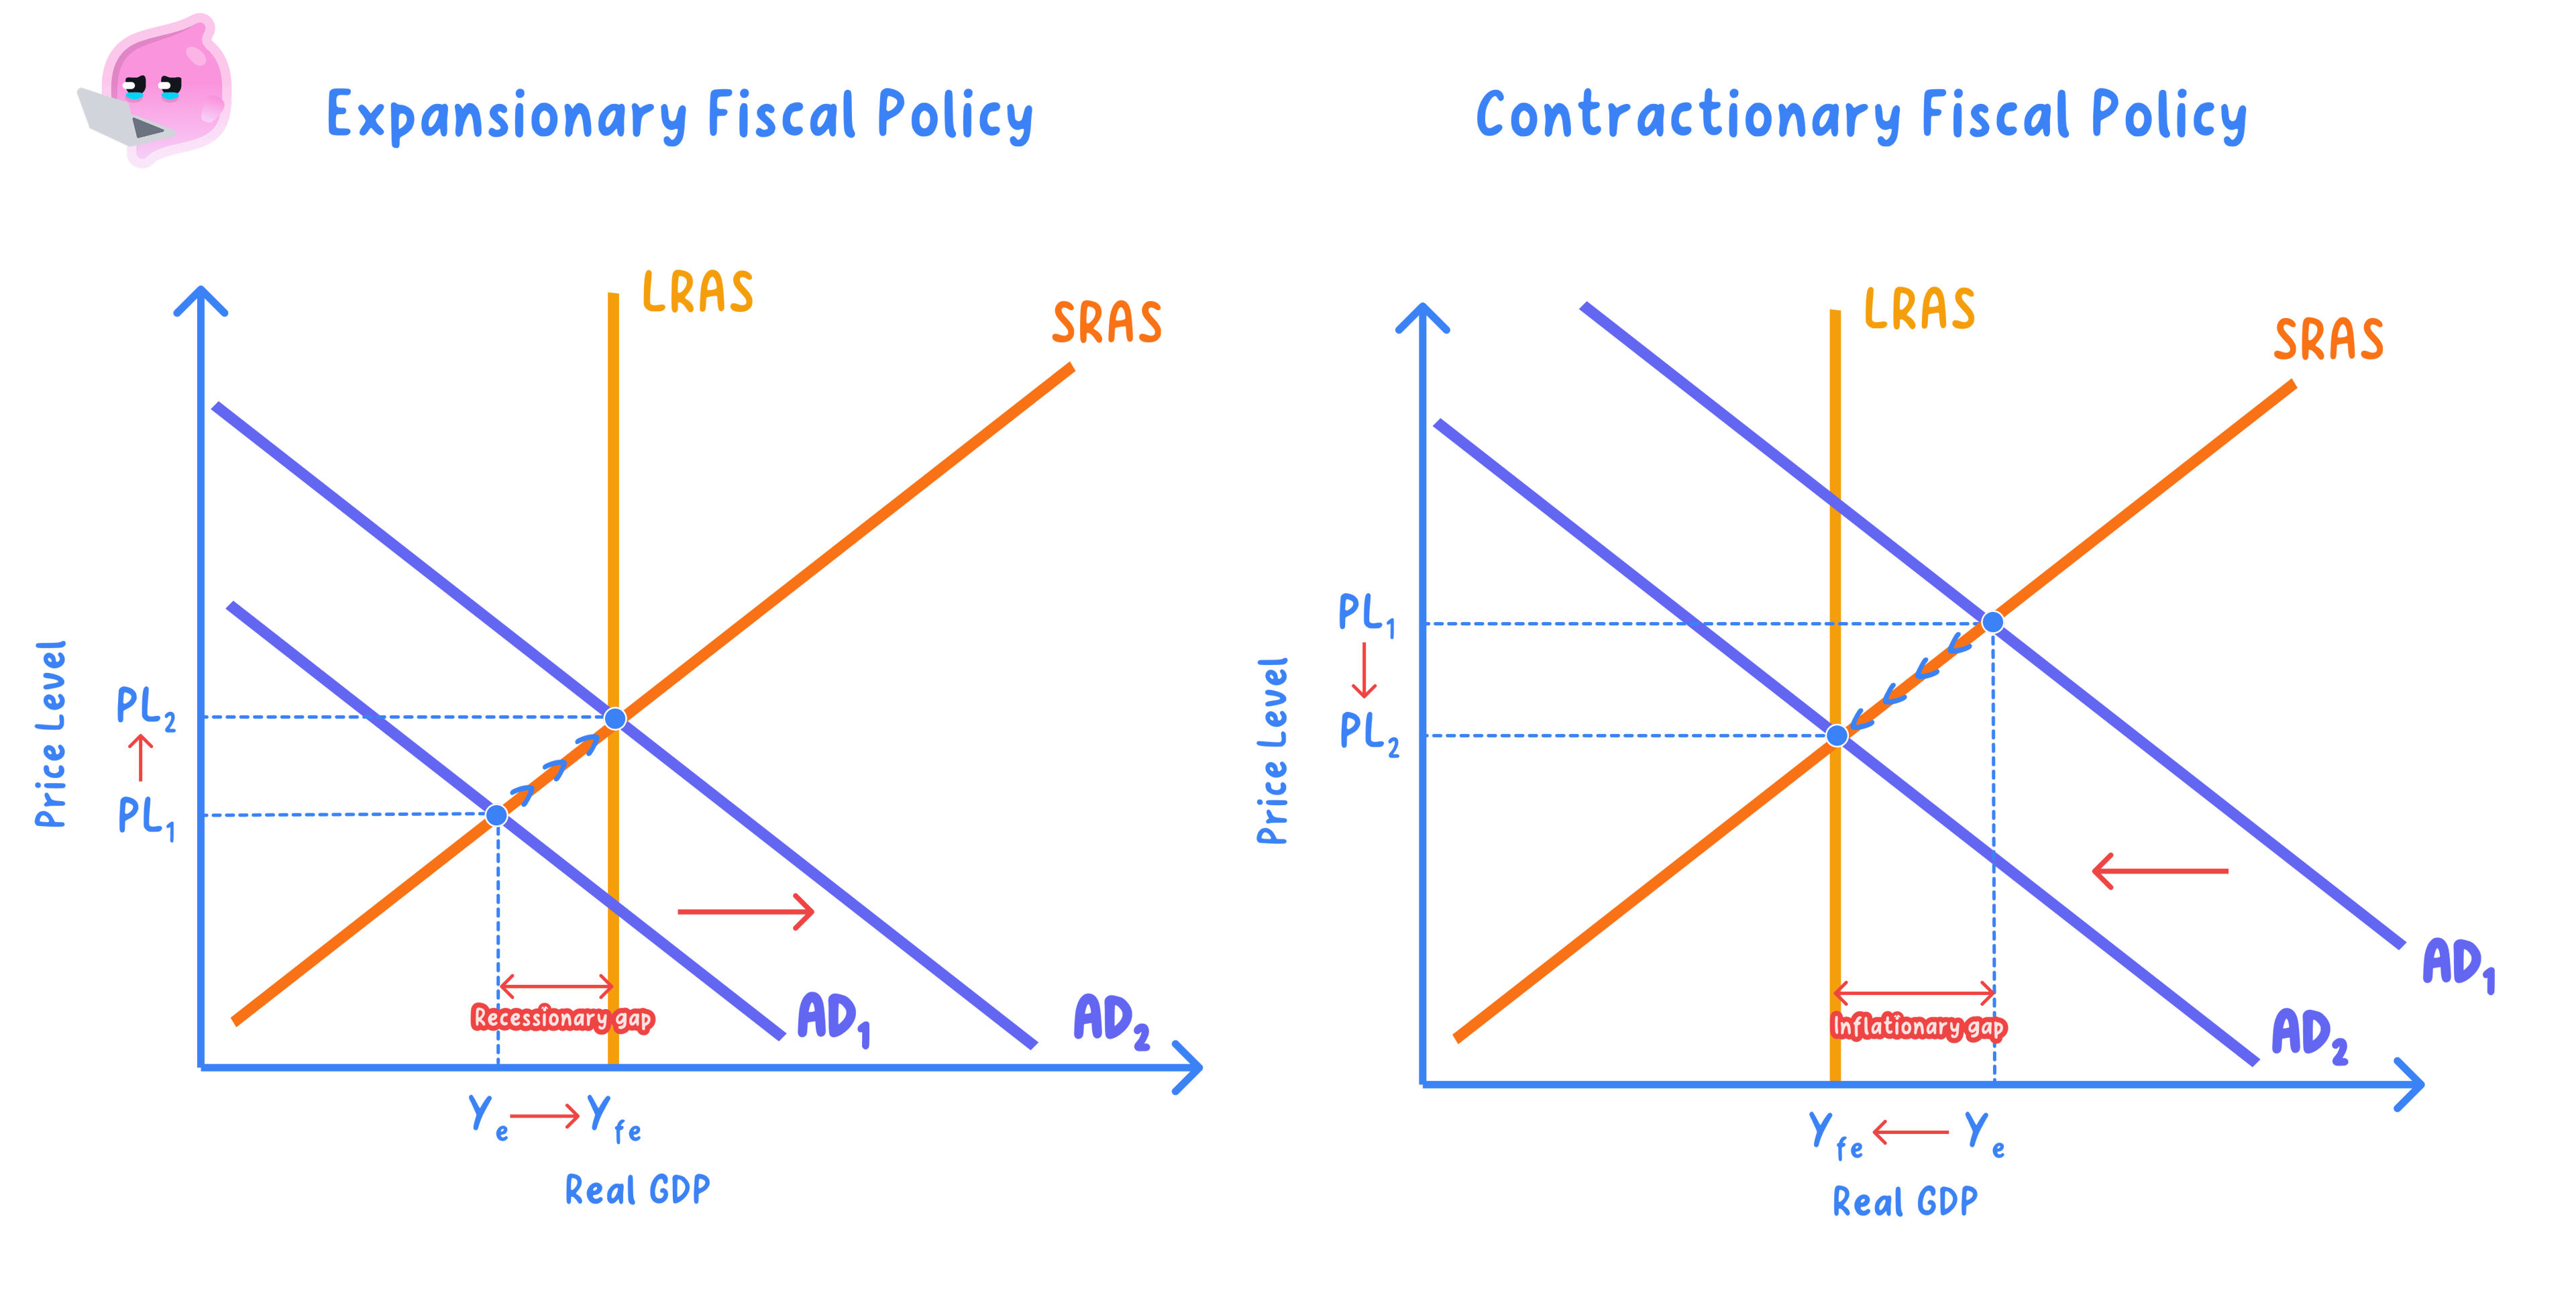
- On an AD/AS diagram the vertical axis is the average price level and the horizontal axis is real output.
- Equilibrium national income is where the AD curve crosses the AS curve.
- Fiscal policy is shown as a shift of the AD curve, since spending and taxation change total planned spending.
Key Idea
- Fiscal policy moves aggregate demand, not aggregate supply, in this analysis.
- The size of the effect on output and the price level depends on where the economy sits on the AS curve.
Expansionary fiscal policy
- Higher spending or lower taxes shift the AD curve to the right.
- Equilibrium national income rises, so real output and employment increase.
- The average price level tends to rise, especially as the economy nears full capacity.
Example
- An economy has C = £1200bn, I = £300bn, G = £400bn and X − M = −£50bn, and the government raises G by £40bn.
- AD shifts right from £1850bn to £1890bn, so equilibrium national income rises.
- With spare capacity most of this rise becomes extra real output; near full capacity more of it becomes a higher price level.
Contractionary fiscal policy
- Lower spending or higher taxes shift the AD curve to the left.
- Equilibrium national income falls, so real output and employment decrease.
- The average price level tends to fall or rise more slowly, easing inflation.
Example
- An economy is overheating, so the government raises taxes, cutting consumption by £25bn from C = £1200bn.
- Lower C shifts AD left, so the price level eases, with some fall in real output and employment as a trade-off.
It depends on capacity
- On the flat range of the AS curve, an AD shift mainly changes real output.
- On the steep range near full capacity, an AD shift mainly changes the price level.
- This is why the same policy has different effects depending on the state of the economy.
Is expansionary fiscal policy an effective way to raise output?
- In a deep recession with spare capacity, expansionary fiscal policy can work well: a rightward AD shift raises real output and employment, and the initial injection is magnified as extra incomes are respent through the economy.
- However, if the economy is near full capacity, extra government borrowing can push up interest rates and crowd out private investment, so higher G partly replaces I rather than adding to total demand, and much of the AD rise feeds into higher prices rather than output.
- The outcome also depends on time lags and the size of the multiplier: policy takes time to design and implement, and if households save much of a tax cut the multiplier is small, so the boost to national income is weaker than the headline figure suggests.
- On balance, expansionary fiscal policy is most effective when there is a large negative output gap, a high multiplier and limited crowding out. Its success depends on the state of the economy, the size of the multiplier, the response of interest rates and investment, and how quickly the policy takes effect.
Exam technique
- Draw the AD/AS diagram with the price level on the vertical axis and real output on the horizontal axis.
- Show fiscal policy as a labelled shift of AD with an arrow, then mark the new equilibrium.
- Report the effect on national income, real output, the price level and employment together.
Common Mistake
- Do not shift the AS curve when analysing fiscal policy in this topic.
- Government spending and taxation shift AD, and shifting AS would misread the diagram.
- Do not claim output rises with no effect on the price level regardless of capacity.
- Near full capacity most of an AD rise feeds into higher prices.
Self review
- Label the axes of an AD/AS diagram.
- Which curve does fiscal policy shift, and in which direction for expansionary policy?
- State the effect of contractionary fiscal policy on output, the price level and employment.
- An economy has C = £900bn, I = £250bn, G = £350bn and X − M = £20bn; calculate AD.
- Why does the size of the price-level effect depend on spare capacity?
