x

What is a histogram?

What is a histogram?
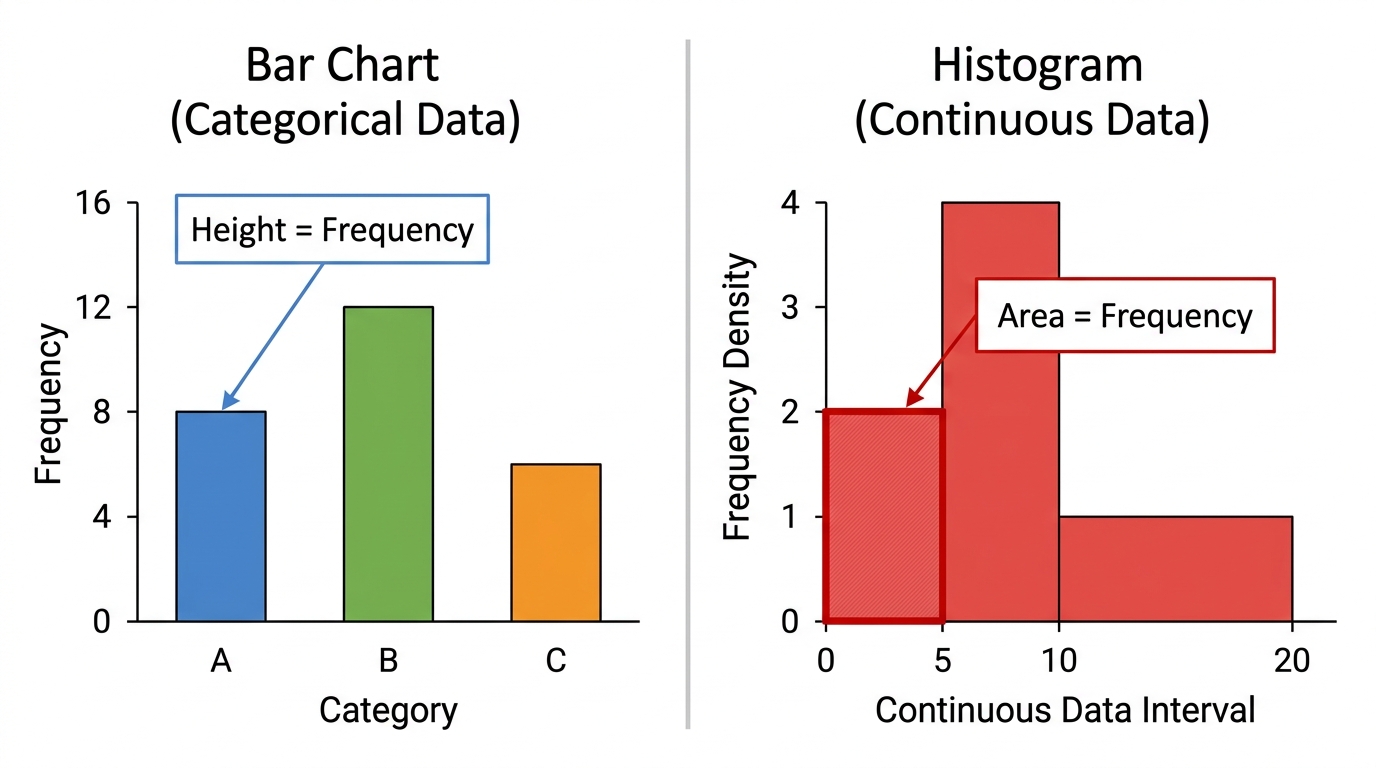
Comparison of a bar chart with gaps and a histogram with touching bars, showing height equals frequency for the bar chart and area equals frequency for the histogram

A histogram is used for grouped continuous data such as time, length, or mass. The bars touch because values can occur anywhere within the intervals. In a histogram, the area of each bar represents frequency.

Histograms Lesson

  1. IGCSE
  2. /Maths
  3. /Histograms

Step-by-step lessons covering Oxford AQA IGCSE Maths Histograms for Core and Extended tier. Each lesson works through exam-style questions in Paper 1 and Paper 2 (Core: 1C and 2C; Extension: 1E and 2E) format. Since content from any part of the specification can appear on either paper, keep number and algebra fluency sharp throughout the course rather than leaving it until near the exam.

Lessons