Revision notes for Oxford AQA IGCSE Maths Drawing Quadratic Graphs. Open the guide for explanations and worked examples. Written against the Oxford AQA IGCSE Maths (9260) specification, so the content matches what's examinable rather than general Maths background.
Drawing Quadratic Graphs
What you'll learn
- How to recognise a quadratic graph and its curved shape.
- How to complete a table of values by substituting different x-values.
- How to plot the coordinates accurately and join them with a smooth curve.
- How to check your graph using intercepts, symmetry and the turning point.
The basic idea
A straight-line graph comes from equations like y=2x+1y=2x+1y=2x+1. A quadratic graph comes from an equation containing an x2x^2x2 term, such as y=x2−2x−3y=x^2-2x-3y=x2−2x−3.
Definition
Quadratic graph
A quadratic graph is the graph of an equation where the highest power of xxx is x2x^2x2. Its shape is called a parabola, which is a smooth U-shaped curve or upside-down U-shaped curve.
Quadratic graphs are not drawn with a ruler through the points. They are curved, so you draw a smooth curve passing through the plotted points.
Key Idea
Main takeaway
To draw a quadratic graph, you usually make a table of values, plot the coordinates, then draw a smooth parabola through the points.
Prerequisite: coordinates
A coordinate tells you the position of a point on a graph. It is written as an ordered pair, like (2,5)(2,5)(2,5).
The first number is the x-coordinate, which tells you how far left or right to move. The second number is the y-coordinate, which tells you how far up or down to move.
Example
Plotting a coordinate
Plot the point (3,−2)(3,-2)(3,−2).
-
Start at the origin, which is the point (0,0)(0,0)(0,0).
-
Move 3 squares to the right because the x-coordinate is positive 3.
-
Move 2 squares down because the y-coordinate is negative 2.
-
Mark the point with a small cross and label it if needed.
Common Mistake
Swapping the coordinates
The point (3,−2)(3,-2)(3,−2) is different from (−2,3)(-2,3)(−2,3). Always move along the x-axis first, then up or down for the y-coordinate.
Substituting into a quadratic
To draw the graph, you need several coordinates. You get these by choosing x-values and substituting them into the equation to find the matching y-values.
Definition
Substitution
Substitution means replacing a variable with a number. For example, if y=x2+1y=x^2+1y=x2+1 and x=3x=3x=3, then you replace xxx with 3.
Be especially careful when substituting negative numbers. A negative number squared becomes positive, so (−2)2=4(-2)^2=4(−2)2=4.
Example
Finding one y-value
For the equation y=x2−2x−3y=x^2-2x-3y=x2−2x−3, find yyy when x=−2x=-2x=−2.
-
Write the equation and replace xxx with -2:
y=(−2)2−2(−2)−3y=(-2)^2-2(-2)-3y=(−2)2−2(−2)−3 -
Work out each part. Remember that (−2)2=4(-2)^2=4(−2)2=4 and −2(−2)=4-2(-2)=4−2(−2)=4.
-
Add the values together:
y=4+4−3=5y=4+4-3=5y=4+4−3=5 -
So when x=−2x=-2x=−2, the coordinate is (−2,5)(-2,5)(−2,5).
Common Mistake
Forgetting brackets with negatives
If x=−2x=-2x=−2, then x2x^2x2 means (−2)2(-2)^2(−2)2, not −22-2^2−22. Use brackets when substituting negative values into squared terms.
Completing a table of values
A table of values is a table showing several x-values and their matching y-values. It gives you the coordinates you need to plot.
You are often given the x-values. Your job is to fill in the missing y-values by substituting each x-value into the equation.
Example
Completing a table for a quadratic
Complete the table for y=x2−2x−3y=x^2-2x-3y=x2−2x−3.
| x | -2 | -1 | 0 | 1 | 2 | 3 | 4 |
|---|---|---|---|---|---|---|---|
| y |
-
Substitute x=−2x=-2x=−2:
y=(−2)2−2(−2)−3=5y=(-2)^2-2(-2)-3=5y=(−2)2−2(−2)−3=5 -
Substitute x=−1x=-1x=−1:
y=(−1)2−2(−1)−3=0y=(-1)^2-2(-1)-3=0y=(−1)2−2(−1)−3=0 -
Substitute x=0x=0x=0:
y=02−2(0)−3=−3y=0^2-2(0)-3=-3y=02−2(0)−3=−3 -
Substitute x=1x=1x=1:
y=12−2(1)−3=−4y=1^2-2(1)-3=-4y=12−2(1)−3=−4 -
Continue in the same way for x=2x=2x=2, x=3x=3x=3 and x=4x=4x=4.
-
Fill in the completed table:
| x | -2 | -1 | 0 | 1 | 2 | 3 | 4 |
|---|---|---|---|---|---|---|---|
| y | 5 | 0 | -3 | -4 | -3 | 0 | 5 |
Tip
Use the shape to check the table
Quadratic tables often have a pattern. In this example the y-values go 5, 0, -3, -4, -3, 0, 5, which is symmetric around the lowest value.
Plotting the points
Once your table is complete, turn each column into a coordinate:
- x = -2, y = 5 gives (−2,5)(-2,5)(−2,5)
- x = -1, y = 0 gives (−1,0)(-1,0)(−1,0)
- x = 0, y = -3 gives (0,−3)(0,-3)(0,−3)
- x = 1, y = -4 gives (1,−4)(1,-4)(1,−4)
- x = 2, y = -3 gives (2,−3)(2,-3)(2,−3)
- x = 3, y = 0 gives (3,0)(3,0)(3,0)
- x = 4, y = 5 gives (4,5)(4,5)(4,5)
Example
Using a table to list coordinates
Use the completed table to write down the coordinates for the graph of y=x2−2x−3y=x^2-2x-3y=x2−2x−3.
-
Match each x-value with the y-value directly underneath it.
-
Write each pair in the form (x,y)(x,y)(x,y).
-
The coordinates are:
(−2,5), (−1,0), (0,−3), (1,−4), (2,−3), (3,0), (4,5)(-2,5),\ (-1,0),\ (0,-3),\ (1,-4),\ (2,-3),\ (3,0),\ (4,5)(−2,5), (−1,0), (0,−3), (1,−4), (2,−3), (3,0), (4,5) -
Plot each point carefully on the coordinate grid.
Common Mistake
Joining points too early
Do not draw the curve until all the points have been plotted. One wrong point can make the whole curve look distorted.
Drawing the smooth curve
After plotting the points, draw a smooth curve through them. For y=x2−2x−3y=x^2-2x-3y=x2−2x−3, the coefficient of x2x^2x2 is positive, so the parabola opens upwards.
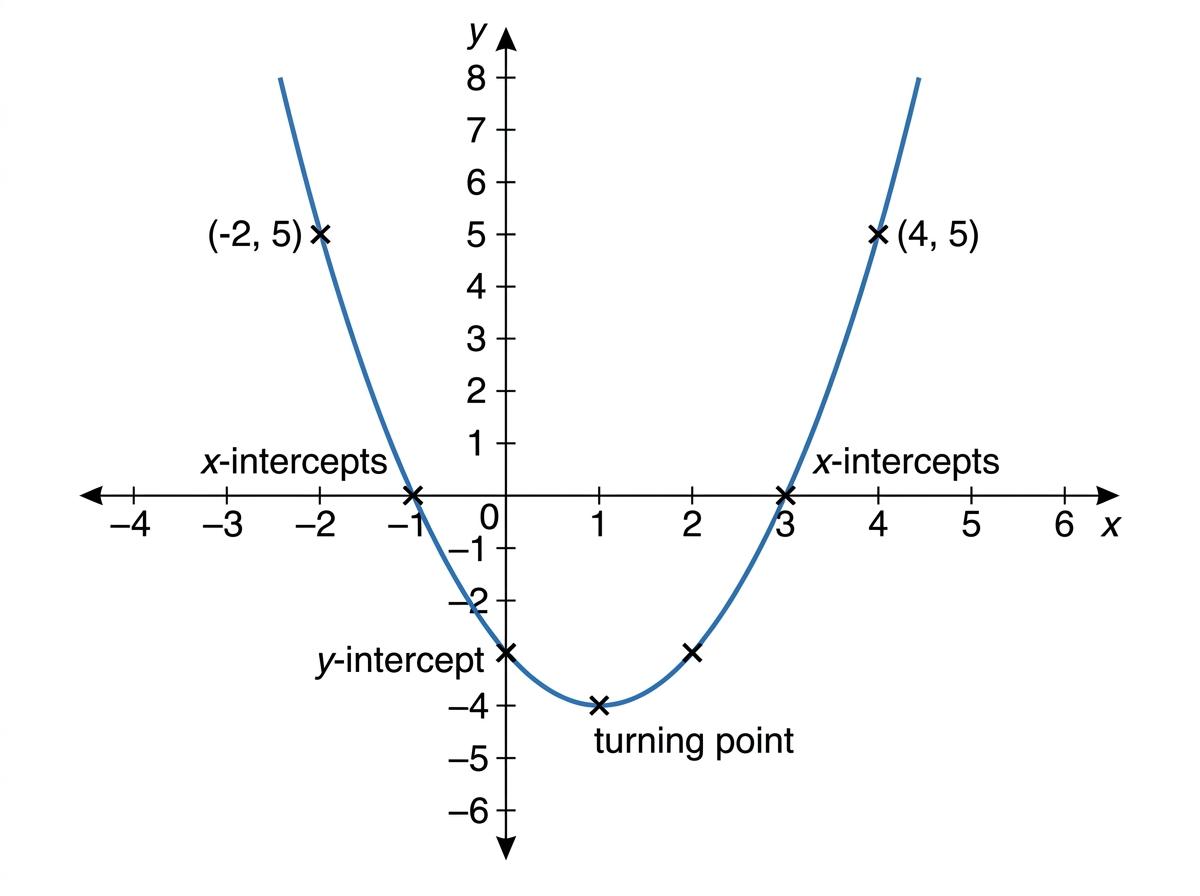
The graph below shows the completed curve for this example, including the intercepts and turning point.
Definition
Turning point and intercepts
The turning point is the point where the parabola changes direction. An x-intercept is where the graph crosses the x-axis. A y-intercept is where the graph crosses the y-axis.
Example
Drawing the graph from the points
Draw the graph of y=x2−2x−3y=x^2-2x-3y=x2−2x−3 using the completed table.
-
Draw a pair of axes with a suitable scale. The x-values go from -2 to 4, and the y-values go from -4 to 5, so make sure your grid includes these values.
-
Plot the coordinates:
(−2,5), (−1,0), (0,−3), (1,−4), (2,−3), (3,0), (4,5)(-2,5),\ (-1,0),\ (0,-3),\ (1,-4),\ (2,-3),\ (3,0),\ (4,5)(−2,5), (−1,0), (0,−3), (1,−4), (2,−3), (3,0), (4,5) -
Check that the points form a smooth U-shape rather than a straight line.
-
Draw a smooth curve through the points, making the bottom of the curve near (1,−4)(1,-4)(1,−4).
-
Extend the curve slightly beyond the end points if the grid allows, but do not invent a completely different shape.
Tip
Pencil first
In an exam, draw the curve lightly in pencil first. If one point looks out of place, recheck its substitution before committing to the curve.
How to check your quadratic graph
There are three useful checks.
1. Check the y-intercept
The y-intercept happens when x=0x=0x=0. For y=x2−2x−3y=x^2-2x-3y=x2−2x−3, substituting x=0x=0x=0 gives y=−3y=-3y=−3, so the graph should cross the y-axis at (0,−3)(0,-3)(0,−3).
2. Check the x-intercepts
The x-intercepts happen when y=0y=0y=0. From the table, y=0y=0y=0 when x is -1 and 3, so the graph should cross the x-axis at (−1,0)(-1,0)(−1,0) and (3,0)(3,0)(3,0).
3. Check the turning point
The turning point should sit in the middle of the symmetry. Here the matching y-values are:
- 5 and 5
- 0 and 0
- -3 and -3
So the lowest point is halfway between the two sides, at about (1,−4)(1,-4)(1,−4).
Example
Spotting an error in a plotted point
A student draws y=x2−2x−3y=x^2-2x-3y=x2−2x−3 but plots the point for x=2x=2x=2 at (2,3)(2,3)(2,3). Explain why this is likely to be wrong.
-
Substitute x=2x=2x=2 into the equation:
y=22−2(2)−3y=2^2-2(2)-3y=22−2(2)−3 -
Simplify the value:
y=4−4−3=−3y=4-4-3=-3y=4−4−3=−3 -
The correct point is (2,−3)(2,-3)(2,−3), not (2,3)(2,3)(2,3).
-
Also, the table has symmetry: the points (0,−3)(0,-3)(0,−3) and (2,−3)(2,-3)(2,−3) should have the same y-value.
Common Mistake
Do not force a straight line
Even if the plotted points look nearly straight over a small section, a quadratic graph must be drawn as a smooth curve, not as joined straight-line segments.
What if the parabola opens downwards?
If the coefficient of x2x^2x2 is negative, the parabola opens downwards instead of upwards. For example, y=−x2+4y=-x^2+4y=−x2+4 has an upside-down U-shape.
Example
A downward quadratic
Complete a few values for y=−x2+4y=-x^2+4y=−x2+4.
-
Substitute x=−2x=-2x=−2:
y=−(−2)2+4=−4+4=0y=-(-2)^2+4=-4+4=0y=−(−2)2+4=−4+4=0 -
Substitute x=0x=0x=0:
y=−(0)2+4=4y=-(0)^2+4=4y=−(0)2+4=4 -
Substitute x=2x=2x=2:
y=−(2)2+4=0y=-(2)^2+4=0y=−(2)2+4=0 -
The points (−2,0)(-2,0)(−2,0), (0,4)(0,4)(0,4) and (2,0)(2,0)(2,0) show that the graph has a highest point instead of a lowest point.
Exam technique
In the exam
-
Complete the table carefully, showing at least one substitution if working marks are available.
-
Plot every coordinate with a small, neat cross, then check for a smooth quadratic pattern.
-
Draw a single smooth curve through the points; do not use a ruler to join them with straight lines.
Self review
Check yourself
- If y=x2+3x−4y=x^2+3x-4y=x2+3x−4, what value of yyy do you get when x=−1x=-1x=−1?
- Why should a quadratic graph be drawn as a curve rather than straight line segments?
- How can the y-intercept help you check whether your graph is sensible?

Recap questions
Test yourself with 5 quick questions on this guide. Answer them all correctly to complete it.
You've reached the end
Test yourself on this topic, or move on to the next guide.
How was this guide?