Revision notes for Oxford AQA IGCSE Maths Averages from Frequency Tables. Open the guide for explanations and worked examples. Written against the Oxford AQA IGCSE Maths (9260) specification, so the content matches what's examinable rather than general Maths background.
Averages from Frequency Tables
What you'll learn
- Read a frequency table, where frequency means “how many”.
- Find the mean, median and mode: three different types of average.
- Use midpoints to estimate a mean from grouped data.
- Find a median class and answer percentage questions from a table.
1. Frequency tables: the basic idea
A frequency table is a compact way of showing repeated data. Instead of writing 2, 2, 2, 2, 2, you can write “2 has frequency 5”.
Definition
Frequency
Frequency means how many times a value, score, result or group occurs.
Definition
Mean, median and mode
- The mean is found by adding all the data values and dividing by how many values there are.
- The median is the middle value after the data has been put in order.
- The mode is the value that occurs most often.
Ungrouped frequency tables
An ungrouped frequency table gives exact values, such as 0 points, 1 point, 2 points, and so on.
Key Idea
Mean from a frequency table
For an exact frequency table, multiply each value by its frequency, add these products, then divide by the total frequency.
Example
Mean number of points
A player records the points scored in 50 games.
| Points | Frequency |
|---|---|
| 0 | 8 |
| 1 | 12 |
| 2 | 17 |
| 3 | 8 |
| 4 | 4 |
| 5 | 1 |
-
Add the frequencies to check the total number of games:
8+12+17+8+4+1=508+12+17+8+4+1=508+12+17+8+4+1=50 -
Multiply each points score by its frequency:
0×8=01×12=122×17=343×8=244×4=165×1=5\begin{aligned} 0 \times 8 &= 0\\ 1 \times 12 &= 12\\ 2 \times 17 &= 34\\ 3 \times 8 &= 24\\ 4 \times 4 &= 16\\ 5 \times 1 &= 5 \end{aligned}0×81×122×173×84×45×1=0=12=34=24=16=5 -
Add the products to find the total number of points:
0+12+34+24+16+5=910+12+34+24+16+5=910+12+34+24+16+5=91 -
Divide by the total frequency:
mean=9150=1.82\text{mean}=\frac{91}{50}=1.82mean=5091=1.82
Common Mistake
Averaging the first column
Do not just average the values in the first column. The frequencies tell you that some values happen many more times than others.
2. Finding a missing frequency
Sometimes the frequency is unknown, often called xxx. Use the total information to build an equation.
Example
Finding a missing frequency
A football team scored a total of 54 goals. The table shows the number of goals scored per game.
| Goals | Frequency |
|---|---|
| 0 | 9 |
| 1 | 13 |
| 2 | x |
| 3 | 5 |
| 4 or more | 0 |
-
Work out the known contribution to the total goals:
0×9+1×13+3×5=280 \times 9+1 \times 13+3 \times 5=280×9+1×13+3×5=28 -
The 2-goal row contributes 2x2x2x goals, so form an equation:
2x+28=542x+28=542x+28=54 -
Solve the equation:
2x+28=542x=26x=13\begin{aligned} 2x+28&=54\\ 2x&=26\\ x&=13 \end{aligned}2x+282xx=54=26=13
Common Mistake
Open-ended classes
A row such as “4 or more” is only harmless here because its frequency is 0. If an open-ended row has a non-zero frequency, you cannot calculate an exact mean without more information.
3. Median, mode and total from a frequency table
For the median, imagine the data written out in order. You do not need to actually write it all out; use cumulative frequency instead.
Definition
Cumulative frequency
Cumulative frequency is the running total of the frequencies as you move down a table.
Example
Median, mode and total goals
A team played 38 games.
| Goals | Frequency |
|---|---|
| 0 | 6 |
| 1 | 15 |
| 2 | 10 |
| 3 | 7 |
| 4 or more | 0 |
-
There are 38 games, so the median is between the 19th and 20th values.
-
Build cumulative frequencies:
- Up to 0 goals: 6 games
- Up to 1 goal: 21 games
- Up to 2 goals: 31 games
- Up to 3 goals: 38 games
-
The 19th and 20th values are both in the 1-goal row, so the median is 1 goal.
-
The highest frequency is 15, so the mode is 1 goal.
-
Work out the total number of goals:
0×6+1×15+2×10+3×7=560 \times 6+1 \times 15+2 \times 10+3 \times 7=560×6+1×15+2×10+3×7=56
Tip
Median positions
For an even number of values, look for the two middle positions. If both positions are in the same row, the median is that row’s value.
4. Grouped frequency tables and midpoints
Grouped data is data shown in intervals rather than exact individual values. Each interval is called a class interval.
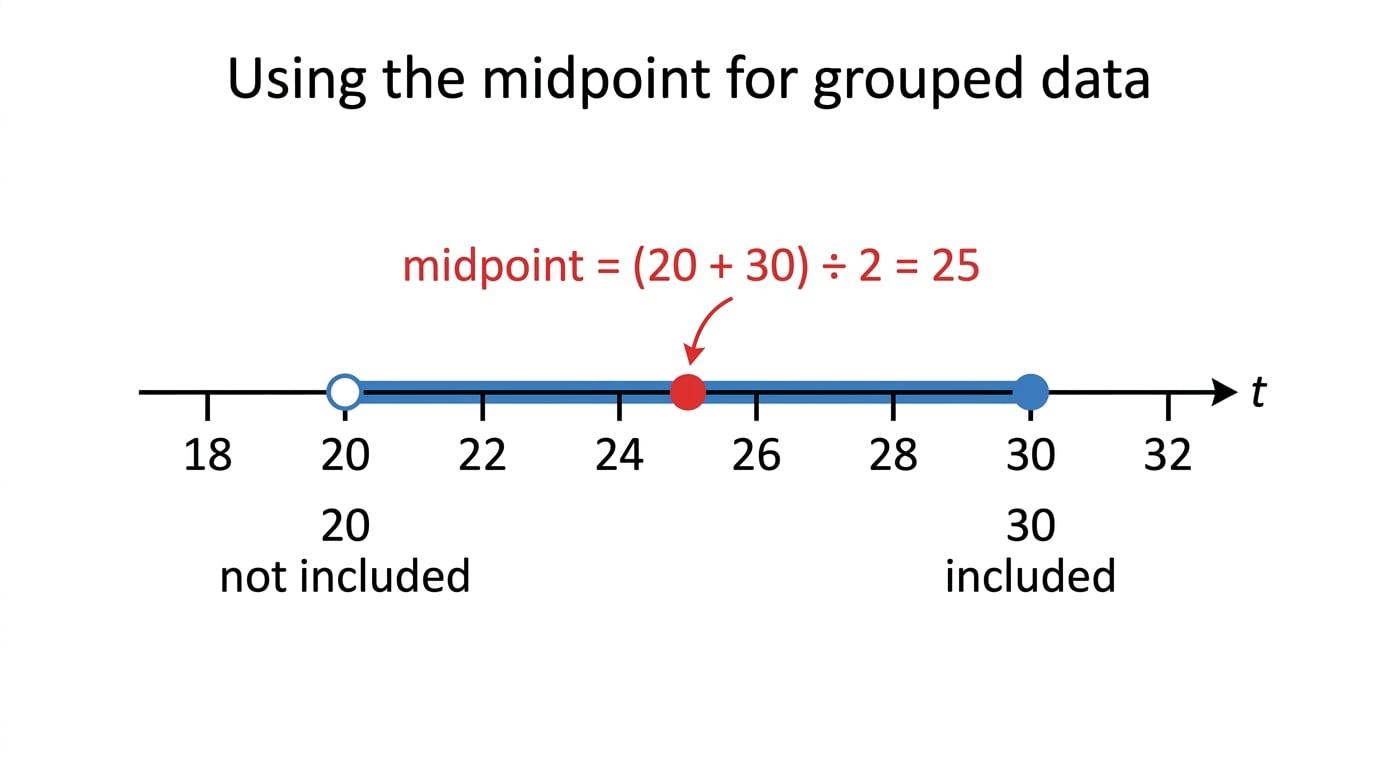
For example, if a table says 20 < t ≤ 30, you know the values are more than 20 and up to 30, but you do not know the exact values.
The midpoint is the halfway value in a class interval. For estimates, we pretend all the values in that interval are at the midpoint.
Key Idea
Estimated mean
For grouped data, use midpoint times frequency. Then divide by the total frequency.
estimated mean=∑(midpoint×frequency)∑frequencies\text{estimated mean}=\frac{\sum(\text{midpoint}\times\text{frequency})}{\sum \text{frequencies}}estimated mean=∑frequencies∑(midpoint×frequency)Example
Estimating the mean height
The heights of 60 plants are grouped as follows.
| Height (cm) | Frequency |
|---|---|
| 140 < h ≤ 150 | 5 |
| 150 < h ≤ 160 | 11 |
| 160 < h ≤ 170 | 16 |
| 170 < h ≤ 180 | 18 |
| 180 < h ≤ 200 | 10 |
-
Find the midpoint of each interval:
145, 155, 165, 175, 190145,\ 155,\ 165,\ 175,\ 190145, 155, 165, 175, 190 -
Multiply each midpoint by its frequency:
145×5=725155×11=1705165×16=2640175×18=3150190×10=1900\begin{aligned} 145 \times 5 &= 725\\ 155 \times 11 &= 1705\\ 165 \times 16 &= 2640\\ 175 \times 18 &= 3150\\ 190 \times 10 &= 1900 \end{aligned}145×5155×11165×16175×18190×10=725=1705=2640=3150=1900 -
Add these products:
725+1705+2640+3150+1900=10120725+1705+2640+3150+1900=10120725+1705+2640+3150+1900=10120 -
Divide by the total frequency to get 168.7 cm to 1 decimal place:
1012060=168.666…≈168.7\frac{10120}{60}=168.666\ldots \approx 168.76010120=168.666…≈168.7 -
This is an estimate because the exact plant heights inside each interval are not known.
Common Mistake
Wrong midpoint
Do not assume every interval has the same width. For 180 < h ≤ 200, the midpoint is 190, not 185.
5. Median class and percentages
For grouped data, you usually cannot find the exact median. Instead, you find the median class, which is the class interval containing the middle value.
Example
Travel times to an event
The table shows travel times for 100 people.
| Time (minutes) | Frequency |
|---|---|
| 0 < t ≤ 10 | 12 |
| 10 < t ≤ 20 | 18 |
| 20 < t ≤ 30 | 24 |
| 30 < t ≤ 40 | 28 |
| 40 < t ≤ 50 | 13 |
| 50 < t ≤ 60 | 5 |
-
To find the percentage who travelled for more than 30 minutes, add the frequencies above 30 minutes:
28+13+5=4628+13+5=4628+13+5=46 -
Since the total is 100 people, the percentage is 46%.
-
For the median class, the middle values are the 50th and 51st values.
-
Use cumulative frequencies:
- Up to 10 minutes: 12 people
- Up to 20 minutes: 30 people
- Up to 30 minutes: 54 people
-
The 50th and 51st values are in the interval 20 < t ≤ 30, so this is the median class.
-
To estimate the mean, use midpoints 5, 15, 25, 35, 45 and 55:
5×12+15×18+25×24+35×28+45×13+55×5=27705 \times 12+15 \times 18+25 \times 24+35 \times 28+45 \times 13+55 \times 5=27705×12+15×18+25×24+35×28+45×13+55×5=2770 -
Divide by 100:
2770100=27.7\frac{2770}{100}=27.71002770=27.7
6. When the data is shown in a bar chart
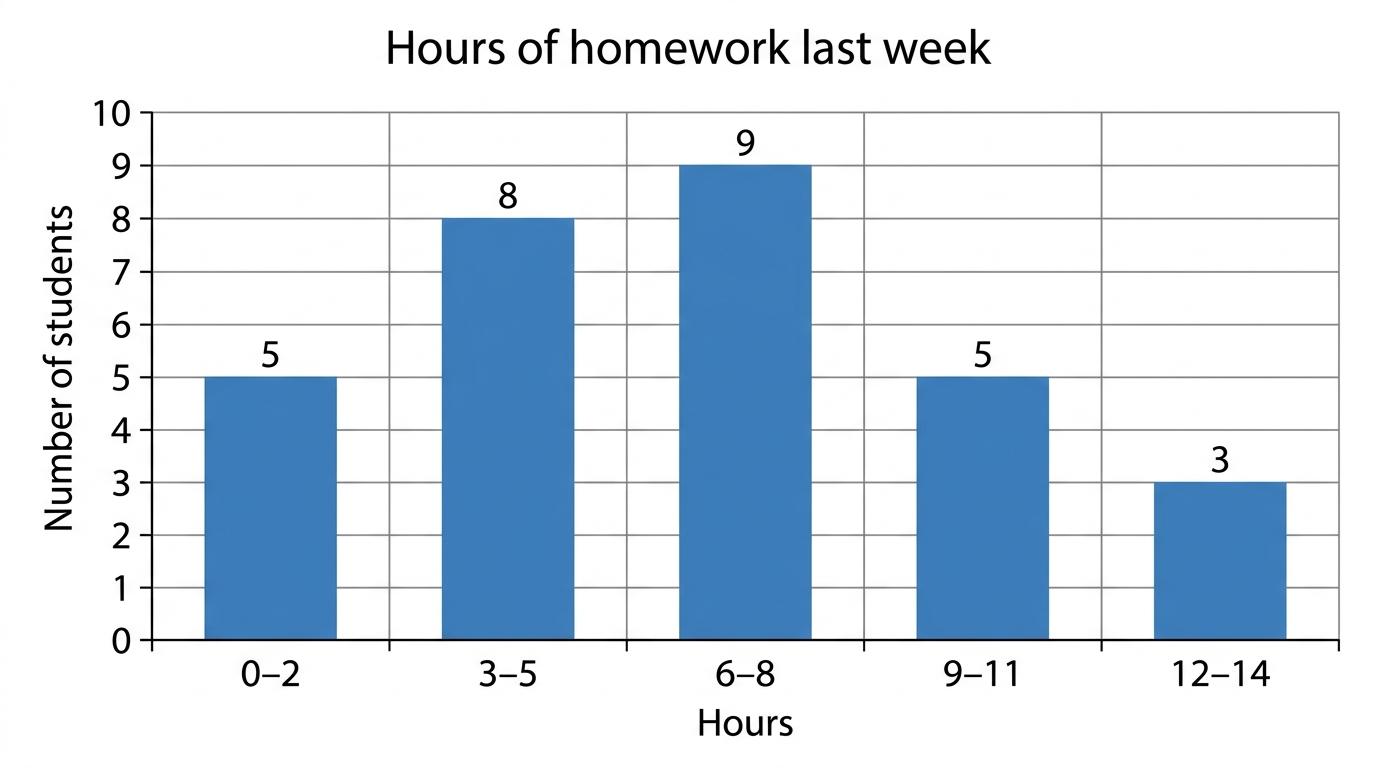
Sometimes the frequencies are shown on a bar chart instead of already being in a table. First read the bar heights, then use the same midpoint method.
Example
Estimated mean from a bar chart
A bar chart shows homework hours for 30 students. The bar heights are 5, 8, 9, 5 and 3 for the groups 0–2, 3–5, 6–8, 9–11 and 12–14 hours.
-
Find the midpoint of each group:
1, 4, 7, 10, 131,\ 4,\ 7,\ 10,\ 131, 4, 7, 10, 13 -
Multiply each midpoint by the frequency:
1×5+4×8+7×9+10×5+13×3=1891 \times 5+4 \times 8+7 \times 9+10 \times 5+13 \times 3=1891×5+4×8+7×9+10×5+13×3=189 -
Divide by the total number of students:
18930=6.3\frac{189}{30}=6.330189=6.3
Tip
Bar chart first step
If the question gives a bar chart, write down the frequencies before calculating. This helps you avoid misreading a bar halfway through your working.
Exam technique
In the exam
- For the mean, make a “value or midpoint times frequency” column in your working.
- Always divide by the total frequency, not by the number of rows.
- For medians, use cumulative frequencies and state which position or positions you are checking.
- For grouped data, remember to say the mean is an estimate because the exact values are unknown.
Self review
Check yourself
- If a value has frequency 12, what does that mean in words?
- How would you find the midpoint of 30 < t ≤ 40?
- Why does a grouped frequency table usually only give an estimated mean?

Recap questions
Test yourself with 5 quick questions on this guide. Answer them all correctly to complete it.
You've reached the end
Test yourself on this topic, or move on to the next guide.
How was this guide?