What a pie chart shows
What a pie chart shows
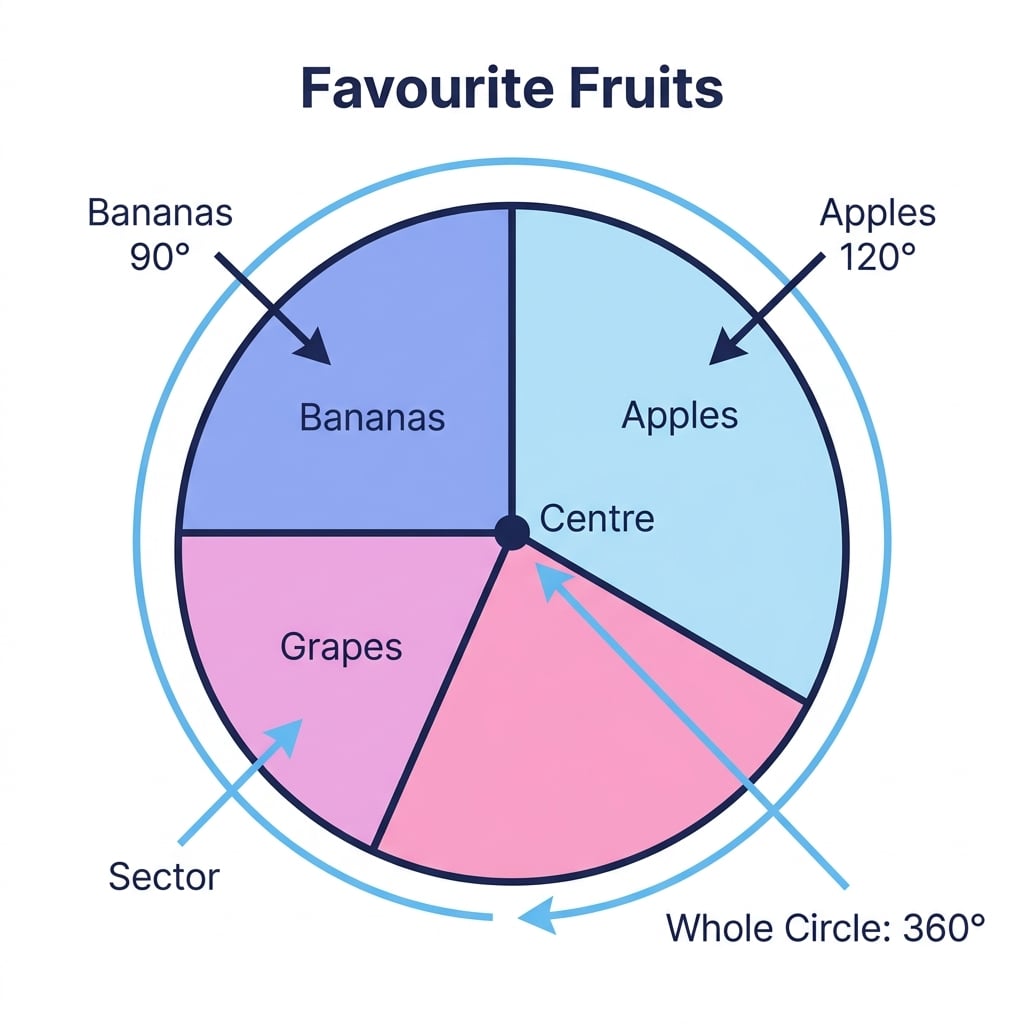
A pie chart is a circle split into sectors, with each sector showing one category from the data. The whole circle represents the total, so all the sector angles must add to 360∘360^{\circ}360∘.
What a pie chart shows
What a pie chart shows
A pie chart is a circle split into sectors, with each sector showing one category from the data. The whole circle represents the total, so all the sector angles must add to 360∘360^{\circ}360∘.
Step-by-step lessons covering Oxford AQA IGCSE Maths Pie Charts for Core and Extended tier. Each lesson works through exam-style questions in Paper 1 and Paper 2 (Core: 1C and 2C; Extension: 1E and 2E) format. Since content from any part of the specification can appear on either paper, keep number and algebra fluency sharp throughout the course rather than leaving it until near the exam.