Revision notes for Edexcel IGCSE Maths Conditional Probability. Open the guide for explanations and worked examples. Written against the Edexcel IGCSE Maths (4MA1) specification, so the content matches what's examinable rather than general Maths background.
Conditional Probability
What you'll learn
- How to recognise when a probability changes after something has happened.
- How to draw and use probability tree diagrams.
- When to multiply probabilities and when to add them.
- How to use Venn diagrams before choosing people at random.
Probability recap
Definition
Outcome and event
An outcome is one possible result, such as choosing a red counter. An event is a set of outcomes you are interested in, such as choosing a red counter or choosing two counters the same colour.
For equally likely outcomes:
probability=number of successful outcomestotal number of outcomes\text{probability}=\frac{\text{number of successful outcomes}}{\text{total number of outcomes}}probability=total number of outcomesnumber of successful outcomesProbabilities are always between 0 and 1. A probability of 0 means impossible, and a probability of 1 means certain.
Example
One draw from a bag
A bag contains 9 counters: 4 yellow and 5 blue. One counter is chosen at random. Find the probability it is blue.
-
Count the total number of counters:
4+5=94+5=94+5=9 -
Count the successful counters. There are 5 blue counters.
-
Write the probability as a fraction:
P(blue)=59P(\text{blue})=\frac{5}{9}P(blue)=95
What conditional probability means
Definition
Conditional probability
Conditional probability means the probability of something happening given that something else has already happened. It is often written as P(B∣A)P(B\mid A)P(B∣A), meaning “the probability of event BBB given event AAA”.
In many IGCSE questions, conditional probability appears when objects are chosen without replacement.
Definition
Without replacement
Without replacement means the first item is not put back before the second item is chosen. So the total number of items changes, and sometimes the number of successful items changes too.
Example
A changed second probability
A bag contains 7 orange counters and 5 purple counters. One counter is chosen and not replaced. Given that the first counter was purple, find the probability that the second counter is orange.
-
Start with 12 counters altogether.
-
The first counter was purple, so one purple counter has been removed. There are now 11 counters left.
-
The number of orange counters has not changed. There are still 7 orange counters.
-
Write the conditional probability:
P(orange second∣purple first)=711P(\text{orange second}\mid \text{purple first})=\frac{7}{11}P(orange second∣purple first)=117
Common Mistake
Using the original total again
If an item is not replaced, the second denominator is one less than the first. For example, after choosing 1 counter from 8, the next denominator is 7, not 8.
Probability tree diagrams
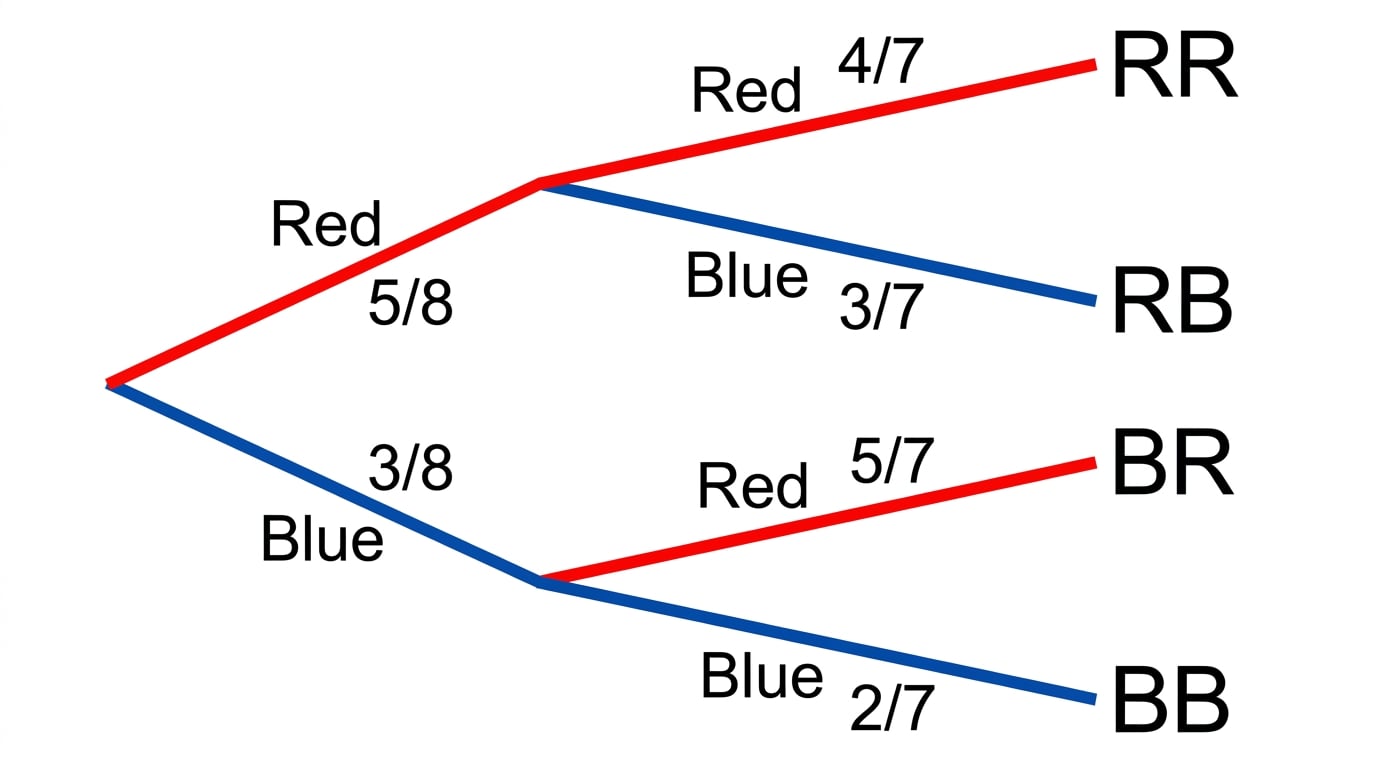
A probability tree diagram shows each stage of a probability problem as branches. Each branch is labelled with the probability of that outcome.
Here is the shape of a tree diagram for choosing two counters without replacement.
Key Idea
Multiply along, add between routes
For a complete route through a tree, multiply along the branches. If there is more than one successful route, add the route probabilities.
Example: one of each colour
Example
Two counters without replacement
A bag contains 5 red counters and 3 blue counters. Two counters are chosen at random without replacement. Find the probability that one counter of each colour is chosen.
-
The first counter is red with probability 58\frac{5}{8}85 and blue with probability 38\frac{3}{8}83.
-
If the first counter is red, there are 4 red and 3 blue left, out of 7 counters.
-
If the first counter is blue, there are 5 red and 2 blue left, out of 7 counters.
-
“One of each colour” can happen in two orders: red then blue, or blue then red.
-
Multiply along each successful route:
P(red then blue)=58×37=1556P(\text{red then blue})=\frac{5}{8}\times\frac{3}{7}=\frac{15}{56}P(red then blue)=85×73=5615 P(blue then red)=38×57=1556P(\text{blue then red})=\frac{3}{8}\times\frac{5}{7}=\frac{15}{56}P(blue then red)=83×75=5615 -
Add the two route probabilities:
1556+1556=3056=1528\frac{15}{56}+\frac{15}{56}=\frac{30}{56}=\frac{15}{28}5615+5615=5630=2815
“Same colour” questions
For “same colour” questions, list all the ways the two choices can match. With three colours, that might be red-red, blue-blue, or green-green.
Example
Both counters the same colour
A bag contains 10 counters: 4 red, 4 blue, and 2 green. Two counters are chosen without replacement. Find the probability that both counters are the same colour.
-
The successful routes are red-red, blue-blue, and green-green.
-
Work out the red-red route:
410×39=1290\frac{4}{10}\times\frac{3}{9}=\frac{12}{90}104×93=9012 -
Work out the blue-blue route:
410×39=1290\frac{4}{10}\times\frac{3}{9}=\frac{12}{90}104×93=9012 -
Work out the green-green route:
210×19=290\frac{2}{10}\times\frac{1}{9}=\frac{2}{90}102×91=902 -
Add the successful routes:
1290+1290+290=2690=1345\frac{12}{90}+\frac{12}{90}+\frac{2}{90}=\frac{26}{90}=\frac{13}{45}9012+9012+902=9026=4513
Tip
Check the wording carefully
“One of each colour” usually means different colours. “Both the same colour” means matching pairs, so you add only the routes where the two outcomes match.
Tree diagrams with decimals
Sometimes the first event affects the next event, but there are no counters to count. You may be given conditional probabilities in words.
If there are only two possible outcomes, their probabilities add to 1. So if the probability of black is 0.35, the probability of not black is 0.65.
Example
Different choices on two days
On Monday, the probability that Sam wears a black tie is 0.55. If Sam wears a black tie on Monday, the probability he wears a black tie on Tuesday is 0.30. If he does not wear a black tie on Monday, the probability he wears a black tie on Tuesday is 0.65. Find the probability that Sam wears different coloured ties on Monday and Tuesday.
-
On Monday, the probability of black is 0.55, so the probability of red is 0.45.
-
If Monday is black, Tuesday is black with probability 0.30, so Tuesday is red with probability 0.70.
-
If Monday is red, Tuesday is black with probability 0.65.
-
Different coloured ties can happen in two ways: black then red, or red then black.
-
Multiply along the first successful route:
0.55×0.70=0.3850.55\times 0.70=0.3850.55×0.70=0.385 -
Multiply along the second successful route:
0.45×0.65=0.29250.45\times 0.65=0.29250.45×0.65=0.2925 -
Add the two successful routes:
0.385+0.2925=0.67750.385+0.2925=0.67750.385+0.2925=0.6775
Order can matter
In some questions, the order of the two choices matters. “The second number is greater than the first” is not the same as “the two numbers are different”.
A useful method is to count ordered selections: first card then second card.
Example
Second card greater than first
There are six number cards: 1, 1, 2, 3, 3, 4. Two cards are chosen without replacement. Find the probability that the second number is greater than the first.
-
There are 6 choices for the first card and then 5 choices for the second card, so there are 30 ordered selections.
-
If the first card is 1, there are 2 choices for the first card and 4 greater cards available. This gives 8 successful selections.
-
If the first card is 2, there is 1 choice for the first card and 3 greater cards available. This gives 3 successful selections.
-
If the first card is 3, there are 2 choices for the first card and 1 greater card available. This gives 2 successful selections.
-
If the first card is 4, there are no greater cards available.
-
Add the successful selections:
8+3+2=138+3+2=138+3+2=13 -
Write the probability:
1330\frac{13}{30}3013
Venn diagrams before probability
A Venn diagram uses overlapping circles to organise information about sets, such as people who like tea, coffee, and chocolate.
Definition
Set
A set is a collection of items or people with a shared property. For example, the set of people who like coffee contains everyone who said they like coffee.
When a question gives lots of overlapping information, fill the Venn diagram first. Then use the final number you need in a probability calculation.
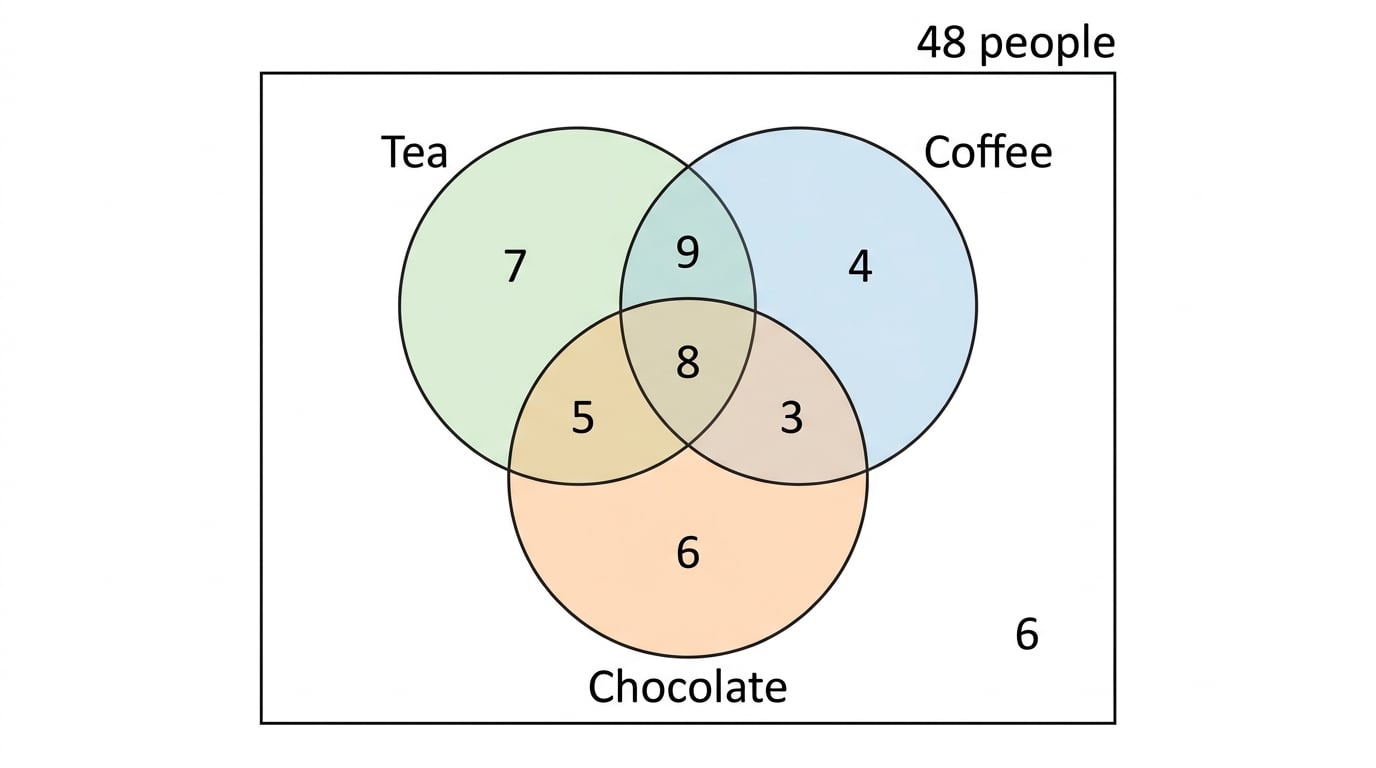
The finished Venn diagram for the example below looks like this.
Example
Choosing two people from a survey
48 people were asked whether they like tea, coffee, and chocolate. 6 people like none of them. 8 people like all three. 29 people like tea. 22 people like chocolate. 17 people like both tea and coffee. 5 like tea and chocolate but not coffee. 3 like coffee and chocolate but not tea. Two people are chosen at random without replacement. Find the probability that they both like coffee.
-
Start in the centre: 8 people like all three.
-
The number who like tea and coffee is 17 altogether, so the tea-and-coffee-only region is:
17−8=917-8=917−8=9 -
Use the tea total of 29 to find tea only:
29−9−5−8=729-9-5-8=729−9−5−8=7 -
Use the chocolate total of 22 to find chocolate only:
22−5−3−8=622-5-3-8=622−5−3−8=6 -
There are 48 people in total and 6 like none, so 42 people are inside the circles.
-
Find coffee only by subtracting the known inside regions from 42:
42−7−9−5−8−3−6=442-7-9-5-8-3-6=442−7−9−5−8−3−6=4 -
Count everyone who likes coffee:
4+9+8+3=244+9+8+3=244+9+8+3=24 -
Choose two coffee-likers without replacement:
2448×2347=2394\frac{24}{48}\times\frac{23}{47}=\frac{23}{94}4824×4723=9423
Exam technique
In the exam
- Decide whether the second probability changes. If there is no replacement, it usually does.
- For tree diagrams, multiply along each complete successful route, then add the successful routes.
- For Venn diagrams, fill the centre and overlaps first, then count the group needed for the probability.
Self review
Check yourself
- If you choose 2 items without replacement from 9, what is the denominator for the second choice?
- In a tree diagram, when do you multiply and when do you add?
- Why should you fill the centre of a three-circle Venn diagram first?

Recap questions
Test yourself with 5 quick questions on this guide. Answer them all correctly to complete it.
You've reached the end
Test yourself on this topic, or move on to the next guide.
How was this guide?