What is a histogram?
What is a histogram?
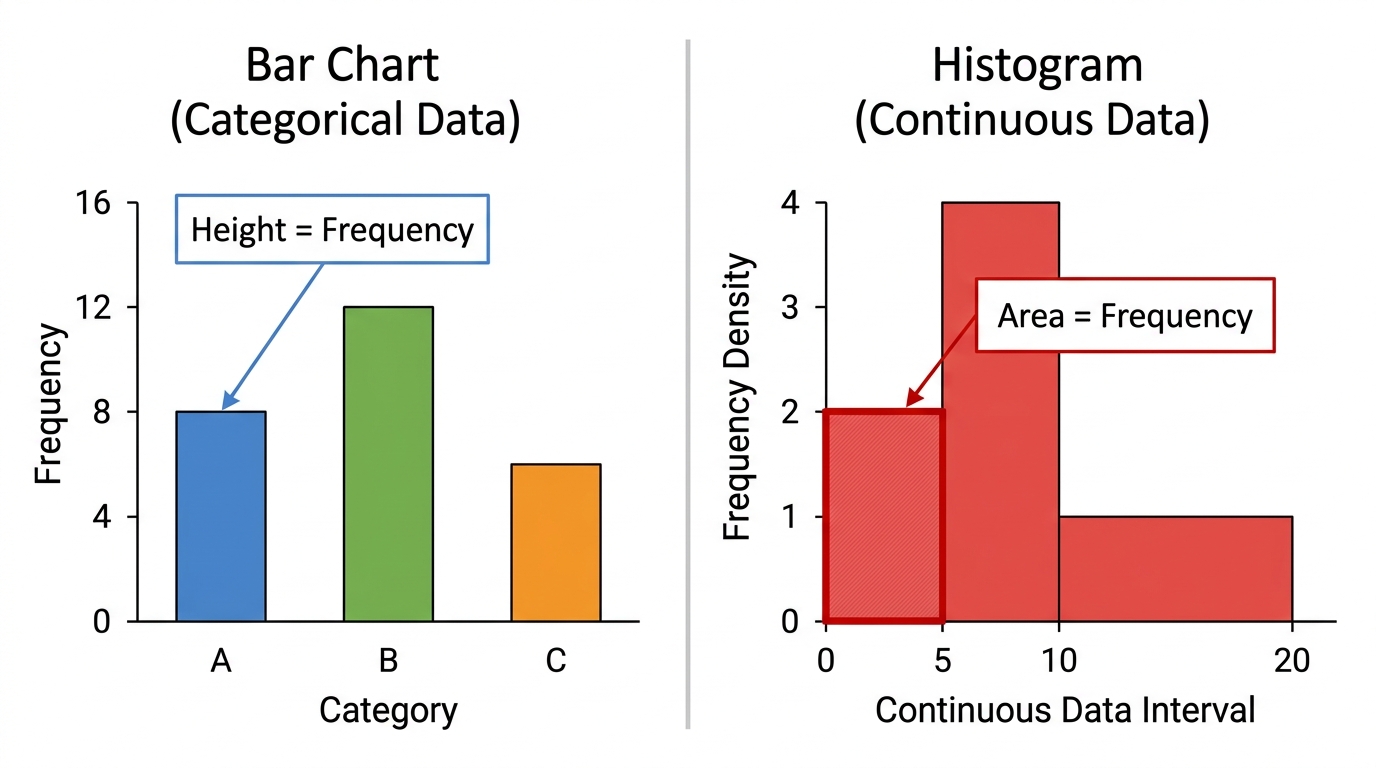
A histogram is used for grouped continuous data such as time, length, or mass. The bars touch because values can occur anywhere within the intervals. In a histogram, the area of each bar represents frequency.
Histograms Lesson
Step-by-step lessons on Edexcel IGCSE Maths Histograms. Each one builds up to exam-style questions. Build confidence with the shared Foundation-tier content first, since roughly 40% of Higher-tier marks are targeted at the grades 4–5 boundary that both tiers have in common.