Bernie is filling up a swimming pool. The graph shows the volume v v\,v of water in the swimming pool at time t t\,t hours.
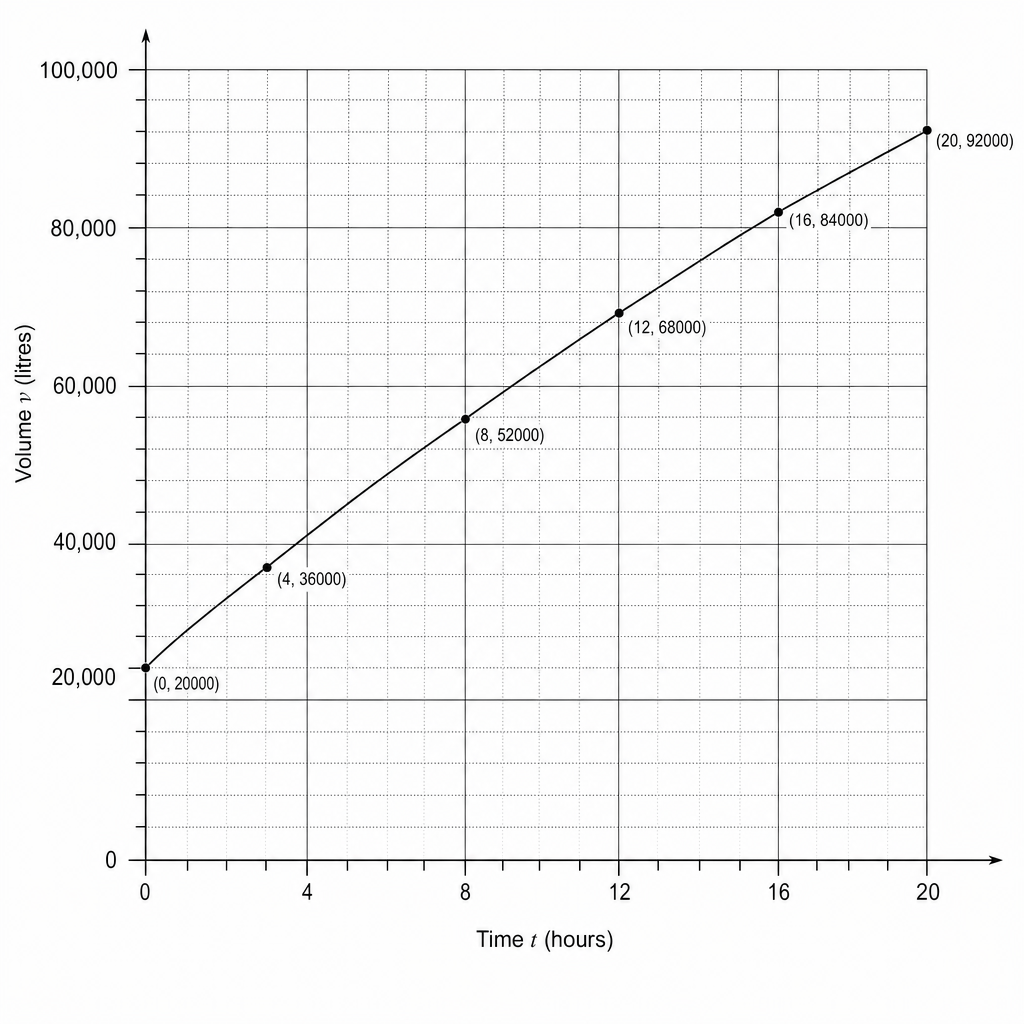
| Time ttt (hours) | Volume vvv (litres) |
|---|---|
| 0 | 20,000 |
| 4 | 36,000 |
| 8 | 52,000 |
| 12 | 68,000 |
| 16 | 84,000 |
| 20 | 92,000 |
A line graph showing volume v versus time t. The y-axis (v) ranges from 0 to 100,000 with major grid lines every 20,000 and minor grid lines every 4,000. The x-axis (t) ranges from 0 to 20 with major grid lines every 4 units and minor grid lines every 1 unit. A straight line starts at (0, 20,000) and ends at (20, 92,000).
Work out the rate of that the water is flowing into the pool.
Give your answer in litres per hour.
Real Life and Distance Time Graphs Questions
Practise Edexcel IGCSE Maths Real Life and Distance Time Graphs with exam-style questions for IGCSE Maths. 21 questions, matched to the Edexcel IGCSE Maths (4MA1) specification and written in Paper 1 and Paper 2 style. Every question includes a full worked solution and mark scheme, so you can see where marks are awarded rather than just whether you got the answer right.