What a pie chart shows
What a pie chart shows
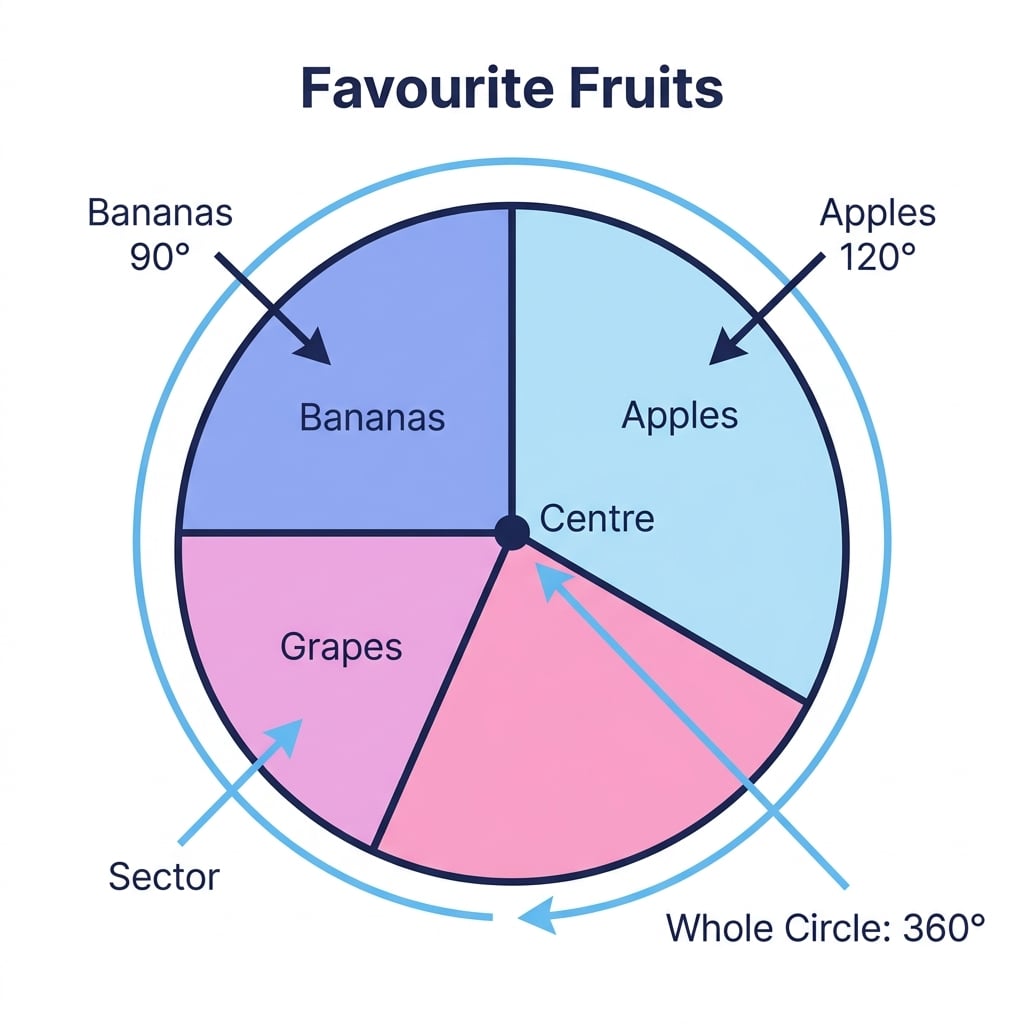
A pie chart is a circle split into sectors, with each sector showing one category from the data. The whole circle represents the total, so all the sector angles must add to 360∘360^{\circ}360∘.
Pie Charts Lesson
Step-by-step lessons on Edexcel IGCSE Maths Pie Charts. Each one builds up to exam-style questions. Build confidence with the shared Foundation-tier content first, since roughly 40% of Higher-tier marks are targeted at the grades 4–5 boundary that both tiers have in common.