Revision notes for CIE IGCSE Maths Histograms. Open the guide for explanations and worked examples. Written against the CIE IGCSE Maths (0580) specification, so the content matches what's examinable rather than general Maths background.
Histograms
What you'll learn
- Why a histogram is different from a bar chart.
- How to find class width and frequency density.
- How to complete missing values in a histogram table.
- How to draw and read histogram bars accurately.
1. What is a histogram?
A frequency is the number of data values in a group.
Continuous data is data that can take any value in a range, such as time, length, mass or speed. For example, a race time might be 12.4 seconds, 12.45 seconds, or 12.451 seconds.
A histogram is used for grouped continuous data.
Definition
Histogram
A histogram is a graph for grouped continuous data. The horizontal axis shows class intervals, the bars touch, and each bar’s area represents the frequency.
This is the key difference from a bar chart:
- In a bar chart, the height of a bar shows the frequency.
- In a histogram, the area of a bar shows the frequency.
Definition
Class interval and class width
- A class interval is a range, such as 0≤t<50 \le t < 50≤t<5.
- The class width is the size of that range: upper boundary minus lower boundary.
Example
Finding class widths from intervals
A grouped table for journey times uses the intervals 0≤t<40 \le t < 40≤t<4, 4≤t<94 \le t < 94≤t<9, and 9≤t<159 \le t < 159≤t<15. Find the class width of each interval.
-
For 0≤t<40 \le t < 40≤t<4, the interval starts at 0 and ends at 4, so the class width is 4.
-
For 4≤t<94 \le t < 94≤t<9, the interval starts at 4 and ends at 9, so the class width is 5.
-
For 9≤t<159 \le t < 159≤t<15, the interval starts at 9 and ends at 15, so the class width is 6.
Tip
Boundary language
The interval 0≤t<50 \le t < 50≤t<5 means “from 0 up to, but not including, 5”. The next interval can start at 5 without overlap.
2. Frequency is the area
Every histogram bar is a rectangle.
For a rectangle:
area=width×height\text{area}=\text{width}\times\text{height}area=width×heightIn a histogram:
- the width is the class width,
- the height is the frequency density,
- the area is the frequency.
Key Idea
The big histogram rule
In histograms, frequency is given by the area of the bar, not just the height.
So the main formula is:
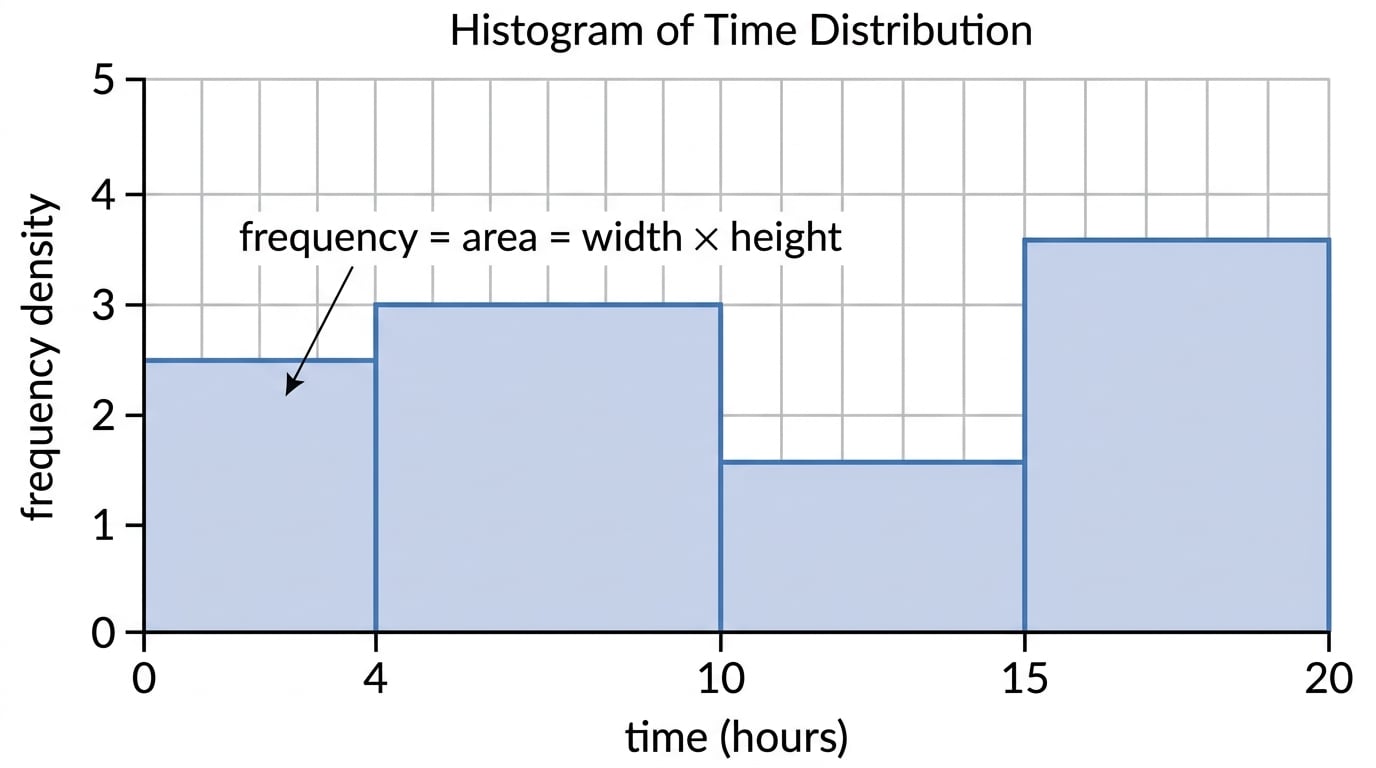
frequency=class width×frequency density\text{frequency}=\text{class width}\times\text{frequency density}frequency=class width×frequency densityThe diagram below shows why wider bars can represent larger frequencies even if they are not very tall.
Example
Using area to find frequency
A histogram bar covers the interval from 5 hours up to 13 hours. Its frequency density is 2.5. Find the frequency for this interval.
-
Find the class width. The interval goes from 5 to 13, so the class width is 8 hours.
-
Use the histogram area rule:
frequency=class width×frequency density\text{frequency}=\text{class width}\times\text{frequency density}frequency=class width×frequency density -
The frequency is 20:
8×2.5=208\times 2.5=208×2.5=20
Common Mistake
Using height as frequency
Do not read the height of a histogram bar as the frequency unless every class width is 1. The frequency is the area, so you must multiply width by height.
3. Frequency density
Sometimes you are given the frequency and need to work out the height of the bar.
That height is called the frequency density.
Definition
Frequency density
Frequency density is the frequency per unit of class width. It is the height you plot on the vertical axis of a histogram.
To find it, divide the frequency by the class width:
frequency density=frequencyclass width\text{frequency density}=\frac{\text{frequency}}{\text{class width}}frequency density=class widthfrequencyExample
Completing a frequency density column
A table shows grouped times for cyclists. Find the frequency density for each interval.
- 0 up to 5 minutes: frequency 12
- 5 up to 11 minutes: frequency 18
- 11 up to 21 minutes: frequency 12
-
First find each class width: 0 up to 5 has width 5, 5 up to 11 has width 6, and 11 up to 21 has width 10.
-
For 0 up to 5 minutes, the frequency density is 2.4:
125=2.4\frac{12}{5}=2.4512=2.4 -
For 5 up to 11 minutes, the frequency density is 3:
186=3\frac{18}{6}=3618=3 -
For 11 up to 21 minutes, the frequency density is 1.2:
1210=1.2\frac{12}{10}=1.21012=1.2 -
The three bar heights should be 2.4, 3, and 1.2.
4. Drawing a histogram
To draw a histogram, you need a frequency density for every class interval.
Your horizontal axis shows the data values, such as time in hours. Your vertical axis shows frequency density.
The bars must touch because the data is continuous. There should be no gaps unless there is a gap in the actual data scale.
Example
Drawing bars from a completed table
A set of download times is grouped like this:
| Time interval | Frequency | Class width | Frequency density |
|---|---|---|---|
| 0 up to 4 | 10 | 4 | 2.5 |
| 4 up to 10 | 18 | 6 | 3 |
| 10 up to 15 | 8 | 5 | 1.6 |
| 15 up to 20 | 18 | 5 | 3.6 |
-
Draw the horizontal axis from 0 to 20 and label it “time”.
-
Draw the vertical axis and label it “frequency density”. The highest frequency density is 3.6, so choose a scale that goes at least this high.
-
Draw the first bar from 0 to 4 with height 2.5.
-
Draw the second bar from 4 to 10 with height 3.
-
Draw the third bar from 10 to 15 with height 1.6.
-
Draw the fourth bar from 15 to 20 with height 3.6.
-
Check one bar using area. For the 4 up to 10 interval, the frequency is 18:
6×3=186\times 3=186×3=18
Tip
Axis check
Before drawing, check the largest frequency density. This tells you how high your vertical scale must go.
5. Completing a partially finished histogram table
Many exam questions give you a partly completed table or a partly completed histogram. You usually need to move between these three quantities:
frequency=class width×frequency density\text{frequency}=\text{class width}\times\text{frequency density}frequency=class width×frequency density frequency density=frequencyclass width\text{frequency density}=\frac{\text{frequency}}{\text{class width}}frequency density=class widthfrequencyExample
Completing missing frequencies and densities
A histogram table for waiting times is partly complete.
| Waiting time | Frequency | Frequency density |
|---|---|---|
| 0 up to 6 | missing | 1.5 |
| 6 up to 10 | missing | 3 |
| 10 up to 18 | missing | 0.75 |
| 18 up to 30 | 18 | missing |
Complete the missing values.
-
For 0 up to 6, the class width is 6. The frequency is 9:
6×1.5=96\times 1.5=96×1.5=9 -
For 6 up to 10, the class width is 4. The frequency is 12:
4×3=124\times 3=124×3=12 -
For 10 up to 18, the class width is 8. The frequency is 6:
8×0.75=68\times 0.75=68×0.75=6 -
For 18 up to 30, the class width is 12. The frequency density is 1.5:
1812=1.5\frac{18}{12}=1.51218=1.5 -
If you were drawing the final bar, it would go from 18 to 30 and have height 1.5.
Common Mistake
Forgetting unequal widths
If one interval is twice as wide as another, the same height gives twice the frequency. Always calculate the width of each class separately.
6. Reading part of a bar
Sometimes a question asks for the frequency in only part of a class interval. You can use the area of that smaller part of the bar.
For example, if a bar has constant height 4 from 10 to 20, then the part from 10 to 15 has width 5 and height 4.
Example
Finding the frequency in part of an interval
A histogram bar goes from 20 minutes up to 35 minutes and has frequency density 2. Estimate the number of people between 25 minutes and 35 minutes.
-
The requested part is from 25 to 35, so its width is 10 minutes.
-
Use area to find the frequency in this part:
frequency=width×frequency density\text{frequency}=\text{width}\times\text{frequency density}frequency=width×frequency density -
The estimated frequency is 20:
10×2=2010\times 2=2010×2=20
Common Mistake
Estimating within a class
When you use part of a bar, you are assuming the data is spread evenly within that class interval. This is an estimate, not an exact count from the raw data.
Exam technique
In the exam
-
Start by writing the class width for every interval.
-
Check whether you need frequency or frequency density, then choose the correct formula.
-
Remember that bars touch, widths come from the horizontal axis, and heights are frequency densities.
Self review
Check yourself
- Can you explain why a histogram bar with height 2 and width 10 has frequency 20?
- Given a frequency of 24 and a class width of 6, can you find the frequency density?
- When drawing a histogram, why is it wrong to leave gaps between neighbouring bars?

Recap questions
Test yourself with 5 quick questions on this guide. Answer them all correctly to complete it.
You've reached the end
Test yourself on this topic, or move on to the next guide.
How was this guide?