Revision notes for CIE IGCSE Maths Venn Diagrams. Open the guide for explanations and worked examples. Written against the CIE IGCSE Maths (0580) specification, so the content matches what's examinable rather than general Maths background.
Venn Diagrams
What you'll learn
- How to read the symbols for “not”, “and”, and “or” in set notation.
- How to shade regions in two-set Venn diagrams.
- How to complete two-set and three-set diagrams from totals.
- How to use Venn diagrams to answer probability questions.
The basic idea
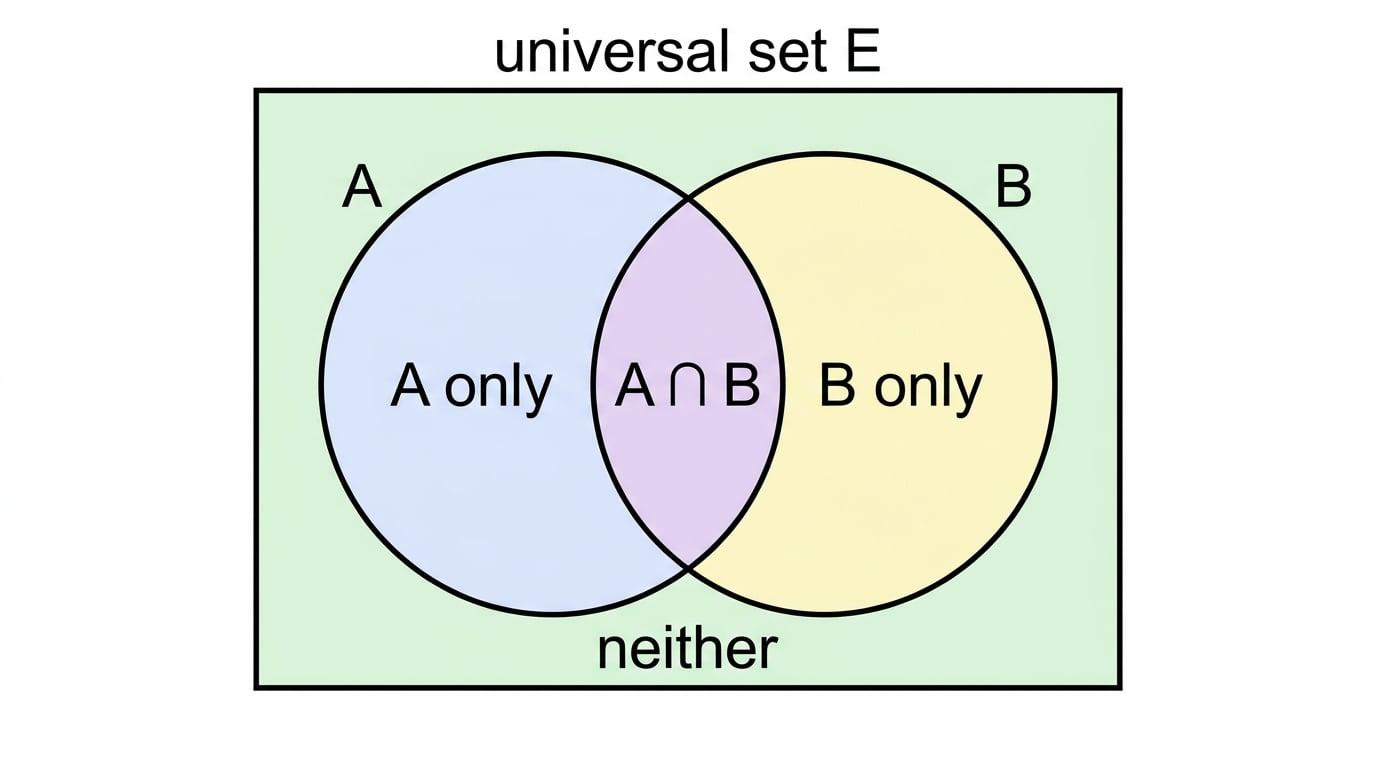
A Venn diagram is a picture used to sort things into groups. Each circle represents a group, called a set. The rectangle around the circles represents everything we are considering.
Definition
Sets and the universal set
- A set is a collection of objects, numbers, or people.
- A member or element is one item inside a set.
- The universal set, usually written as E\mathcal{E}E, means everything that could possibly be included in the diagram.
For two sets, the four main regions are: in A only, in both A and B, in B only, and in neither set.
Example
Sorting numbers into a two-set diagram
The universal set is the numbers from 1 to 10.
Set A contains the even numbers.
Set B contains 6, 7 and 8.
-
Start with the overlap: the numbers in both A and B are 6 and 8.
-
Put the remaining even numbers in A only: 2, 4 and 10.
-
Put the remaining number from B in B only: 7.
-
Everything not already used goes outside the circles: 1, 3, 5 and 9.
Tip
Start with the overlap
When completing a Venn diagram, always deal with the overlap first. The overlap is included inside both circle totals, so leaving it until later often causes double-counting.
Complements: “not in the set”
The dash symbol means not.
Definition
Complement
The complement of A is written as A′A'A′. It means everything in the universal set that is not in A.
If you are working with probabilities, all outcomes together have probability 1. So the probability of “not A” is:
P(A′)=1−P(A)P(A') = 1 - P(A)P(A′)=1−P(A)Example
Finding a complement probability
Given that P(A)=0.64P(A)=0.64P(A)=0.64, find P(A′)P(A')P(A′).
-
A′A'A′ means “not A”.
-
Use the complement rule:
P(A′)=1−P(A)P(A') = 1 - P(A)P(A′)=1−P(A) -
Substitute P(A)=0.64P(A)=0.64P(A)=0.64:
P(A′)=1−0.64=0.36P(A') = 1 - 0.64 = 0.36P(A′)=1−0.64=0.36
Common Mistake
Subtracting from the wrong total
If probabilities are written as decimals or fractions, subtract from 1. If they are written as percentages, subtract from 100%.
Intersection and union
Two of the most important Venn diagram symbols are ∩\cap∩ and ∪\cup∪.
Definition
Intersection and union
- A∩BA \cap BA∩B means A and B. This is the overlap.
- A∪BA \cup BA∪B means A or B or both. This is everything inside either circle.
A good way to remember this is:
- Intersection means the sets cross over.
- Union means the sets are joined together.
Example
Shading a compound region
Describe the region represented by A′∪BA' \cup BA′∪B.
-
First read A′A'A′: this means everything outside A.
-
Then read B: this means everything inside the B circle.
-
The symbol ∪\cup∪ means “or”, so combine both parts.
-
The final shaded region is everything except the A-only region.
Key Idea
Union includes the overlap
A∪BA \cup BA∪B includes A only, B only, and the overlap. Do not leave the overlap out.
Example
Interpreting common shaded regions
For two overlapping circles A and B:
-
A∩BA \cap BA∩B is the middle overlap only.
-
A∪BA \cup BA∪B is everything inside either circle.
-
A′∩B′A' \cap B'A′∩B′ is outside both circles, so it means neither A nor B.
-
A∩B′A \cap B'A∩B′ is the part inside A but outside B, so it means A only.
Completing two-set Venn diagrams from totals
Many questions give you totals, such as “20 people like tennis” and “8 people like both”. Remember: the total for a circle includes the overlap.
Definition
Number in a set
The notation n(A)n(A)n(A) means the number of members in set A.
For two sets:
n(A∪B)=n(A)+n(B)−n(A∩B)n(A \cup B)=n(A)+n(B)-n(A \cap B)n(A∪B)=n(A)+n(B)−n(A∩B)This works because the overlap gets counted twice when you add n(A)n(A)n(A) and n(B)n(B)n(B).
Example
Completing a two-set diagram when the overlap is given
36 students are asked whether they have visited Italy or Germany.
21 have visited Italy, 18 have visited Germany, and 7 have visited both.
-
Put 7 in the overlap because 7 students visited both countries.
-
Italy only is 21 − 7 = 14.
-
Germany only is 18 − 7 = 11.
-
Add the regions inside the circles: 14 + 7 + 11 = 32.
-
There were 36 students altogether, so neither is 36 − 32 = 4.
Sometimes you are told how many people are in neither set instead of being told the overlap.
Example
Completing a two-set diagram when neither is given
50 people are asked whether they have a brother or a sister.
28 have a brother, 24 have a sister, and 6 have neither.
-
Work out how many have at least one: 50 − 6 = 44.
-
Add the two circle totals: 28 + 24 = 52.
-
The overlap has been counted twice in 52, but should only be counted once in 44.
-
The overlap is 52 − 44 = 8, so 8 people have both a brother and a sister.
-
Brother only is 28 − 8 = 20, and sister only is 24 − 8 = 16.
Common Mistake
Forgetting that circle totals include the overlap
If 28 people have a brother and 8 have both, then “brother only” is 20, not 28.
Three-set Venn diagrams
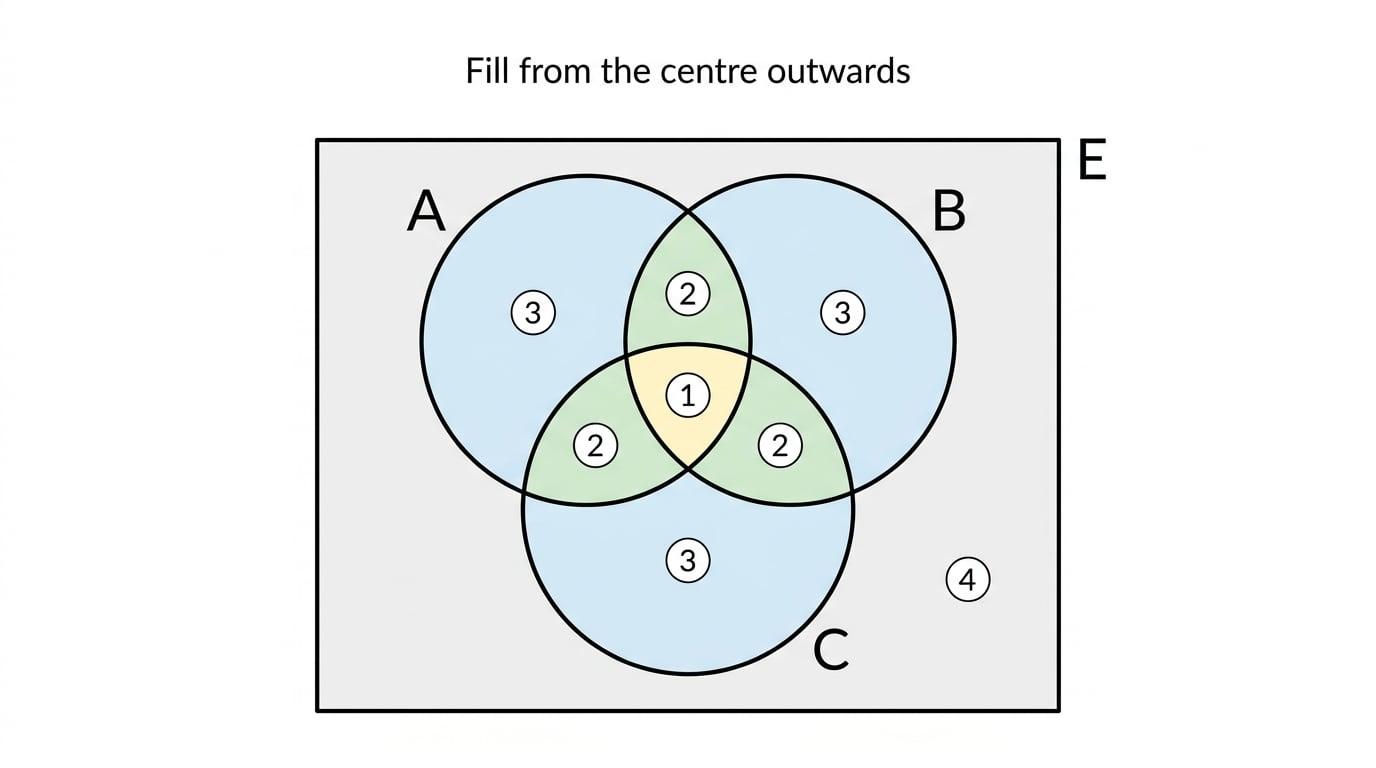
With three sets, the same idea applies, but there are more regions. The safest method is to work from the centre outwards.
Key Idea
Centre outwards
For a three-set Venn diagram, fill in the triple overlap first, then the pair-only overlaps, then the single-only regions, and finally the outside.
Definition
Triple intersection
A∩B∩CA \cap B \cap CA∩B∩C means the members that are in all three sets.
Example
Completing a three-set diagram
60 students are asked which activities they like: art, basketball and choir.
- 4 like all three.
- 15 like art and basketball.
- 12 like basketball and choir.
- 14 like art and choir.
- 31 like art.
- 35 like basketball.
- 28 like choir.
Find how many students like none of the three activities.
-
Put 4 in the centre because 4 students like all three.
-
Work out the pair-only overlaps by subtracting the centre:
art and basketball only=15−4=11basketball and choir only=12−4=8art and choir only=14−4=10\begin{aligned} \text{art and basketball only} &= 15 - 4 = 11 \\ \text{basketball and choir only} &= 12 - 4 = 8 \\ \text{art and choir only} &= 14 - 4 = 10 \end{aligned}art and basketball onlybasketball and choir onlyart and choir only=15−4=11=12−4=8=14−4=10 -
Work out the single-only regions by subtracting everything already inside each circle:
art only=31−11−10−4=6basketball only=35−11−8−4=12choir only=28−10−8−4=6\begin{aligned} \text{art only} &= 31 - 11 - 10 - 4 = 6 \\ \text{basketball only} &= 35 - 11 - 8 - 4 = 12 \\ \text{choir only} &= 28 - 10 - 8 - 4 = 6 \end{aligned}art onlybasketball onlychoir only=31−11−10−4=6=35−11−8−4=12=28−10−8−4=6 -
Add everyone inside the circles:
4+11+8+10+6+12+6=574 + 11 + 8 + 10 + 6 + 12 + 6 = 574+11+8+10+6+12+6=57 -
Subtract from the total: 60 − 57 = 3. So 3 students like none of the activities.
Tip
Pair totals usually include the centre
If a question says “15 like art and basketball”, that usually includes students who also like choir. Subtract the centre to get “art and basketball only”.
Using Venn diagrams for probability
A probability is:
number of favourable outcomestotal number of possible outcomes\frac{\text{number of favourable outcomes}}{\text{total number of possible outcomes}}total number of possible outcomesnumber of favourable outcomesIn Venn diagram questions, the total number of possible outcomes is usually the number in the universal set.
Example
Finding a probability from listed sets
The universal set is the multiples of 3 from 3 to 30.
A={3,6,12,18,24}A=\{3,6,12,18,24\}A={3,6,12,18,24} B={6,15,18,21,30}B=\{6,15,18,21,30\}B={6,15,18,21,30}A number is chosen at random from the universal set. Find P(A∪B)P(A \cup B)P(A∪B).
-
List the universal set:
E={3,6,9,12,15,18,21,24,27,30}\mathcal{E}=\{3,6,9,12,15,18,21,24,27,30\}E={3,6,9,12,15,18,21,24,27,30} -
There are 10 numbers in the universal set.
-
Find the overlap:
A∩B={6,18}A \cap B=\{6,18\}A∩B={6,18} -
Sort the remaining values: A only is 3, 12 and 24; B only is 15, 21 and 30; neither is 9 and 27.
-
A∪BA \cup BA∪B means in A or B or both, so there are 8 favourable numbers.
-
Write the probability:
P(A∪B)=810=45P(A \cup B)=\frac{8}{10}=\frac{4}{5}P(A∪B)=108=54
Common Mistake
Adding elements instead of counting them
If a Venn diagram contains numbers as elements, count how many numbers are in the required region. Do not add the numbers together unless the question specifically asks for a sum.
Reading a completed Venn diagram
Sometimes the diagram is already filled in and you are asked to list members or find a probability.
Example
Reading intersections and unions
In a three-set diagram, suppose the regions contain these members:
- A only: 2, 5
- B only: 11
- C only: 13, 17
- A and B only: 3
- A and C only: 7
- B and C only: 19
- All three: 1, 9
-
To list A∩BA \cap BA∩B, include everything in both A and B.
-
This includes the A and B only region and the all-three region.
-
So:
A∩B={1,3,9}A \cap B=\{1,3,9\}A∩B={1,3,9} -
To find P(B∪C)P(B \cup C)P(B∪C), count everything in B or C or both: 11, 3, 19, 1, 9, 13 and 17.
-
There are 9 members altogether in the universal set, so:
P(B∪C)=79P(B \cup C)=\frac{7}{9}P(B∪C)=97
Exam technique
In the exam
-
Put information into the most specific region first, usually the overlap or the centre.
-
Check whether phrases like “and” include the triple overlap, and subtract it if you need a pair-only region.
-
For probability, count the required region carefully and divide by the total in the universal set.
Self review
Check yourself
- What is the difference between A∩BA \cap BA∩B and A∪BA \cup BA∪B?
- If 40 people were surveyed and 5 are in neither set, how many are in at least one set?
- In a three-set diagram, why should you fill the centre before the pair-only overlaps?

Recap questions
Test yourself with 5 quick questions on this guide. Answer them all correctly to complete it.
You've reached the end
Test yourself on this topic, or move on to the next guide.
How was this guide?