What a pie chart shows
What a pie chart shows
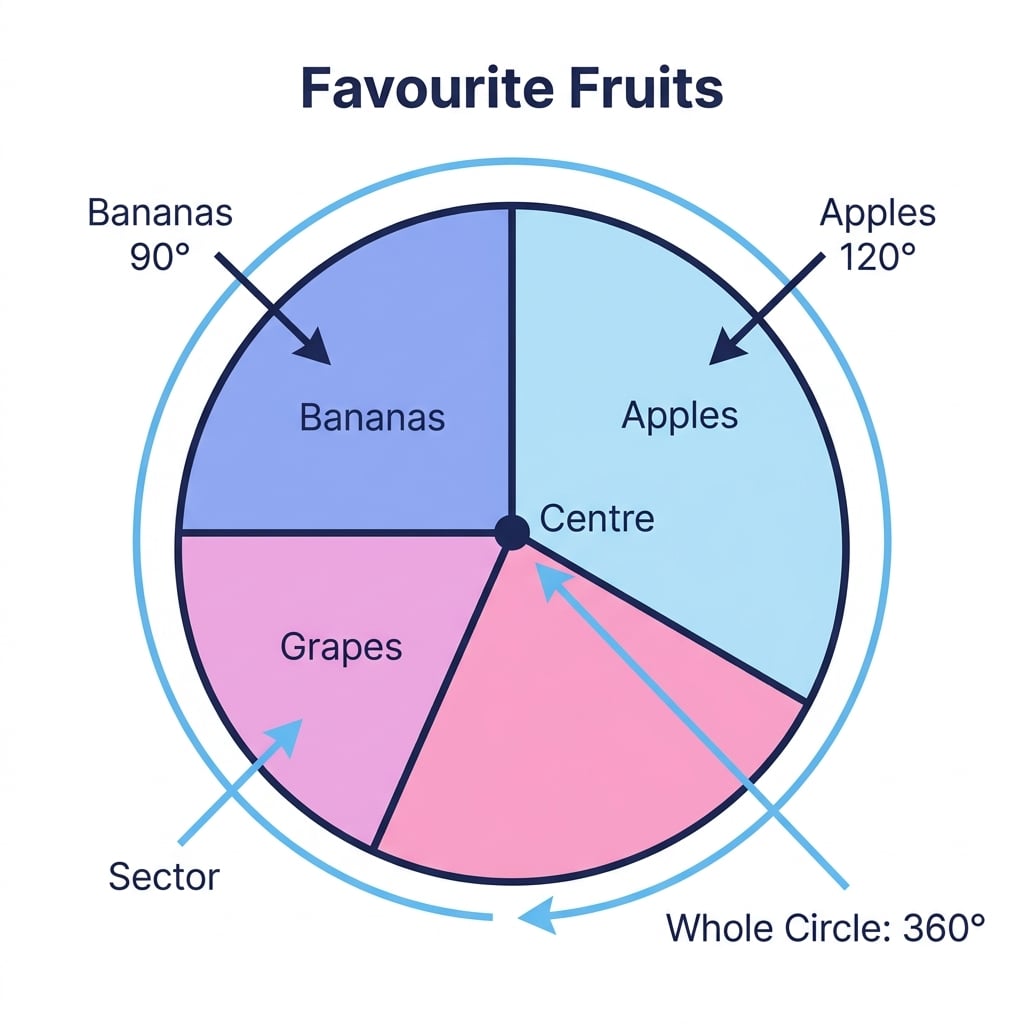
A pie chart is a circle split into sectors, with each sector showing one category from the data. The whole circle represents the total, so all the sector angles must add to 360∘360^{\circ}360∘.
What a pie chart shows
What a pie chart shows
A pie chart is a circle split into sectors, with each sector showing one category from the data. The whole circle represents the total, so all the sector angles must add to 360∘360^{\circ}360∘.
Step-by-step lessons covering CIE IGCSE Maths Pie Charts for Core and Extended tier. Each lesson works through exam-style questions in Paper 1 and Paper 3 (Core) or Paper 2 and Paper 4 (Extended) format. Start with the Core-tier fundamentals in number and algebra before moving on to the more demanding Extended-only topics like calculus-adjacent algebra and advanced trigonometry.