Skip to content
MathsGenie logo
Open app

Course home

  1. IGCSE
  2. Geography Edexcel
  3. Question bank

Urban environments

EasyMediumHard
1234567891011
Question 11

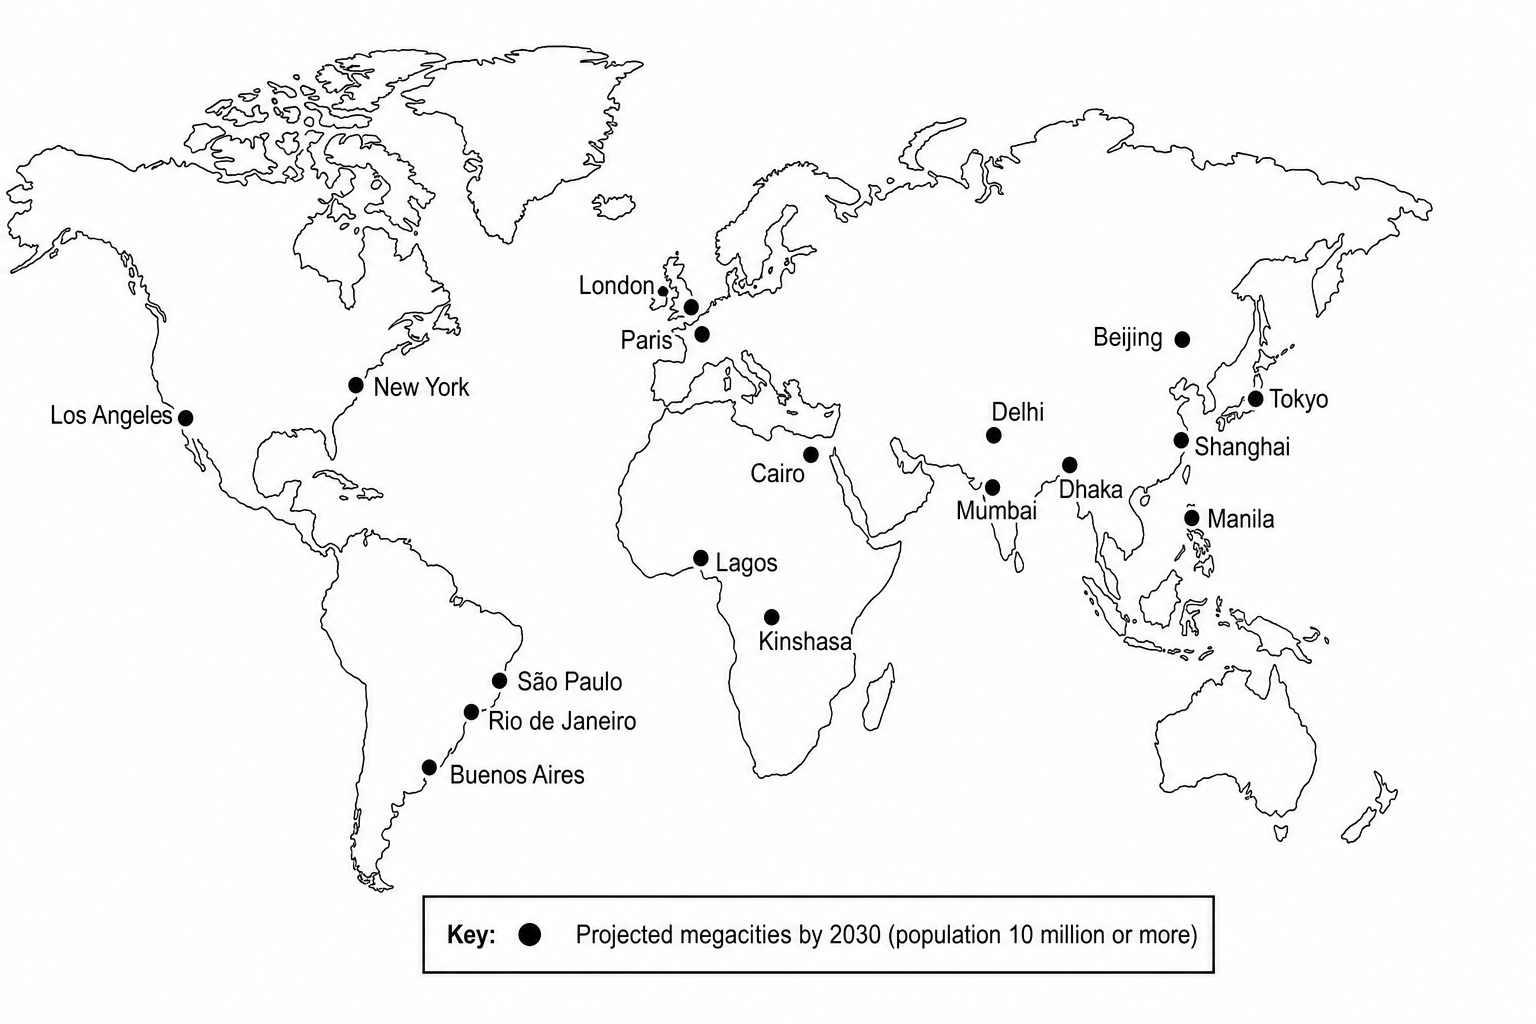
Study Figure 3c, a map showing the global distribution of projected megacities (populations of 10 million or more) by 2030.

A world map showing the projected distribution of megacities (cities with over 10 million people) by 2030. Megacities are represented by dots. There is a massive concentration of dots in South-East Asia, South Asia, and East Asia (including Tokyo, Delhi, Shanghai, Beijing, Mumbai, Manila, and Dhaka). Africa shows major emerging dots (such as Lagos, Cairo, Kinshasa, and Luanda). In contrast, Europe has very few dots (e.g., London, Paris, Moscow). North America has limited dots (New York, Los Angeles), while South America has a cluster mainly along the coastlines (São Paulo, Rio de Janeiro, Buenos Aires, Bogota).

Analyse the reasons for the global distribution of these megacities.
[8]

Urban environments Questions

  1. IGCSE
  2. /Geography
  3. /Urban environments

