Skip to content
MathsGenie logo
Open app

Course home

  1. IGCSE
  2. Geography Edexcel
  3. Question bank

Urban environments

EasyMediumHard
12345678910111213141516171819202122232425262728293031323334353637
Question 18

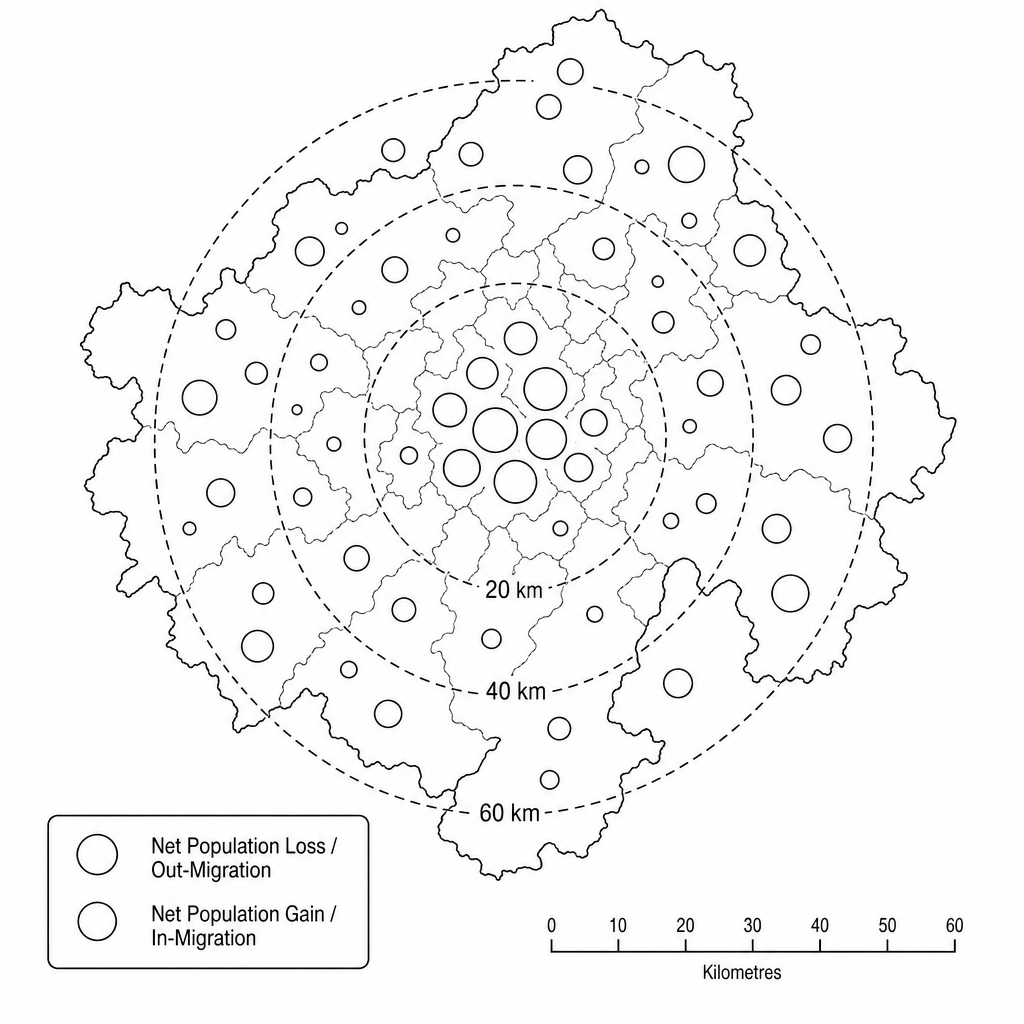
Study Figure 2b, which shows population movement (net migration) in and around a major European metropolitan area.

Map of the Madrid metropolitan region showing population movement between 2012 and 2022. Large orange circles centered on the high-density urban core of Madrid indicate significant net population loss (out-migration). Surrounding rural and semi-rural municipalities, located 20km to 60km away, are covered with green circles of varying sizes, representing net population gain (in-migration).

Suggest one reason for the pattern of population movement shown in Figure 2b.
[3]

Urban environments Questions

  1. IGCSE
  2. /Geography
  3. /Urban environments

