Skip to content
MathsGenie logo
Open app

Course home

  1. IGCSE
  2. Geography Edexcel
  3. Question bank

Globalisation and migration

EasyMediumHard
123456789101112131415161718192021222324252627
Question 24

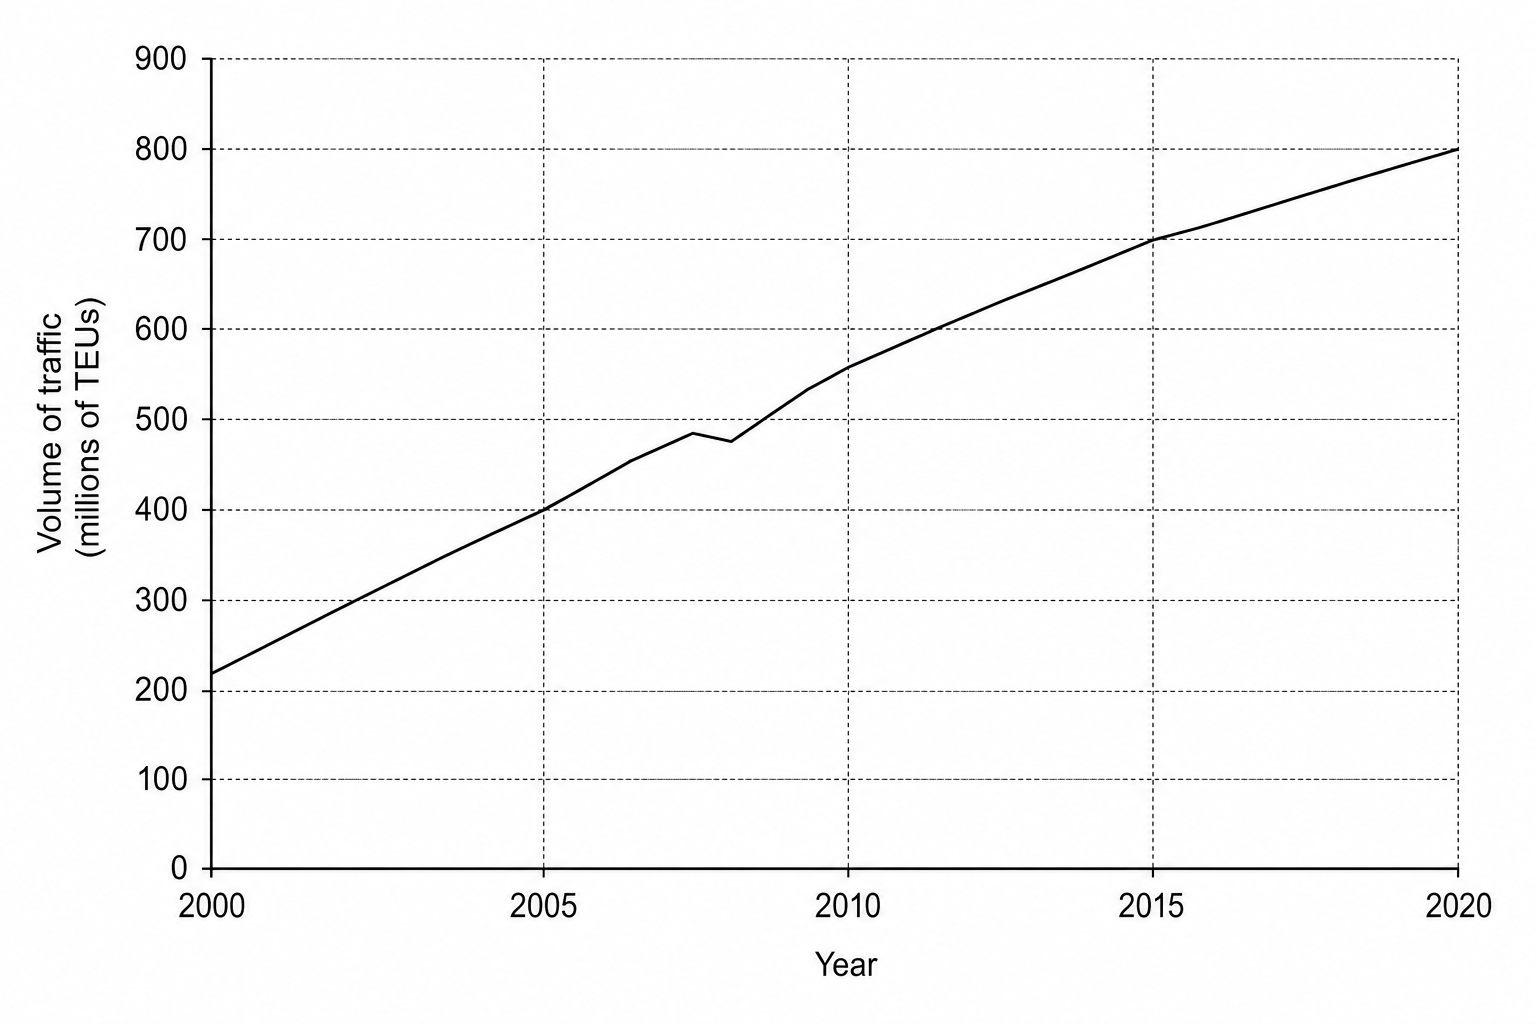
Study Figure 8a, a graph showing the volume of global container shipping traffic between 2000 and 2020.

A line graph showing global container shipping traffic in millions of TEUs (Twenty-Foot Equivalent Units) from 2000 to 2020. The x-axis shows years in 5-year intervals: 2000, 2005, 2010, 2015, and 2020. The y-axis shows traffic volume from 0 to 900 million TEUs. The line starts at 225 million TEUs in 2000, rises steadily to 400 million in 2005, continues upwards to 560 million in 2010 despite a small dip around 2009, climbs to 700 million in 2015, and reaches a peak of approximately 800 million TEUs by 2020.

Suggest one reason why the data in Figure 8a is a good indicator of increased globalisation.
[6]

Globalisation and migration Questions

  1. IGCSE
  2. /Geography
  3. /Globalisation and migration

