Study Figure 9a, a choropleth map showing Foreign Direct Investment (FDI) net inflows per person (USD) in 2021 for selected labelled countries.
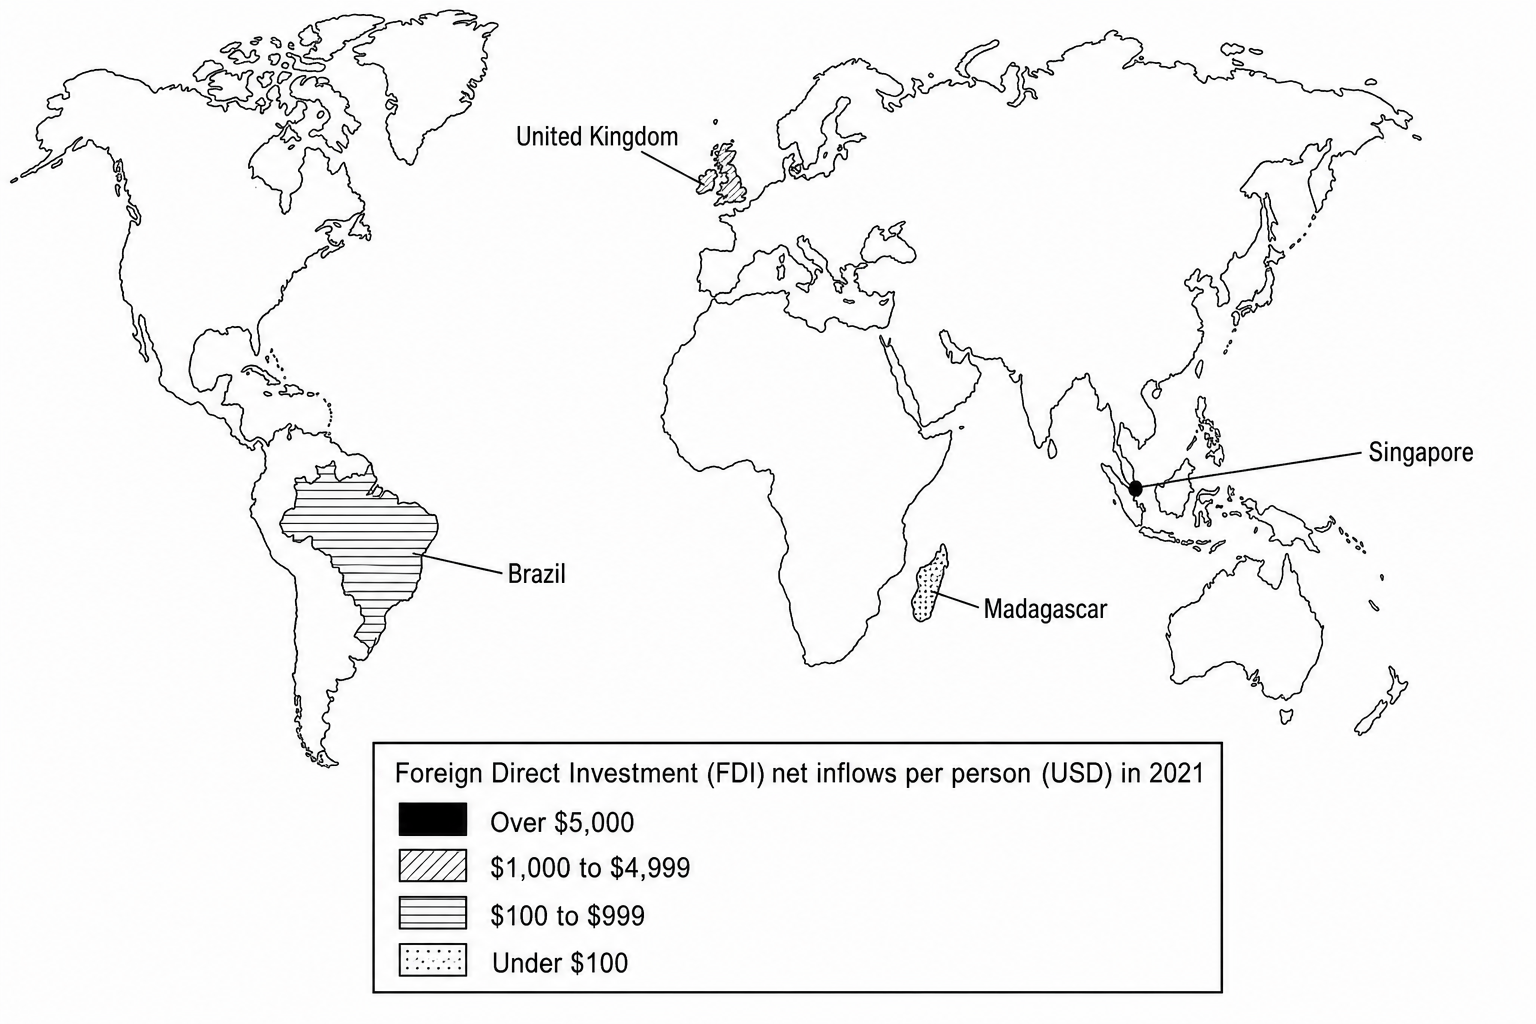
Identify two countries labelled in Figure 9a, one with the highest and one with the lowest Foreign Direct Investment (FDI) net inflows per person.

