Skip to content
MathsGenie logo
Open app

Course home

  1. IGCSE
  2. Geography Edexcel
  3. Question bank

Globalisation and migration

EasyMediumHard
123456789101112131415161718192021222324252627
Question 12

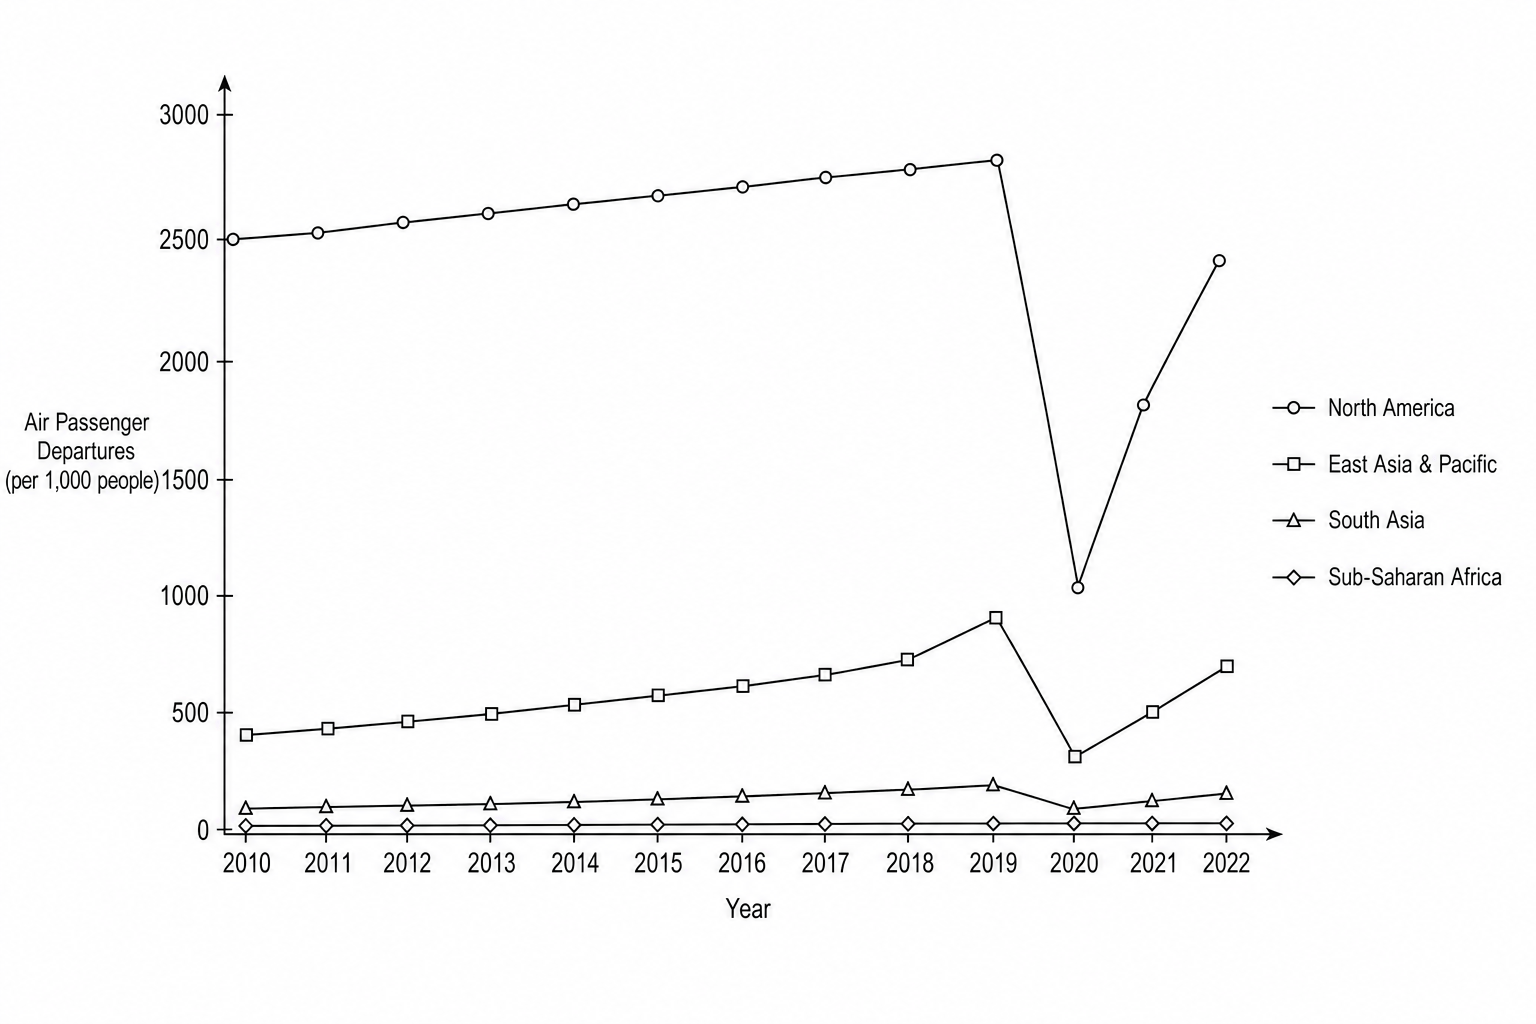
Study Figure 8a, a line graph showing air passenger departures (per 1,000 people) for selected world regions from 2010 to 2022.

Figure 8a: Line graph showing air passenger departures per 1,000 people for four regions from 2010 to 2022. North America starts at 2,500 and rises to 2,800 before dropping sharply in 2020 and recovering to 2,400 in 2022. East Asia & Pacific rises from 400 to 900, falls in 2020, and recovers to 700. South Asia and Sub-Saharan Africa remain extremely low, with South Asia rising slightly from 50 to 150, and Sub-Saharan Africa remaining flat below 50 departures per 1,000 people throughout the entire period.

Suggest one reason why the data in Figure 8a might be a poor indicator of balanced global economic integration.

[2]

Globalisation and migration Questions

  1. IGCSE
  2. /Geography
  3. /Globalisation and migration
