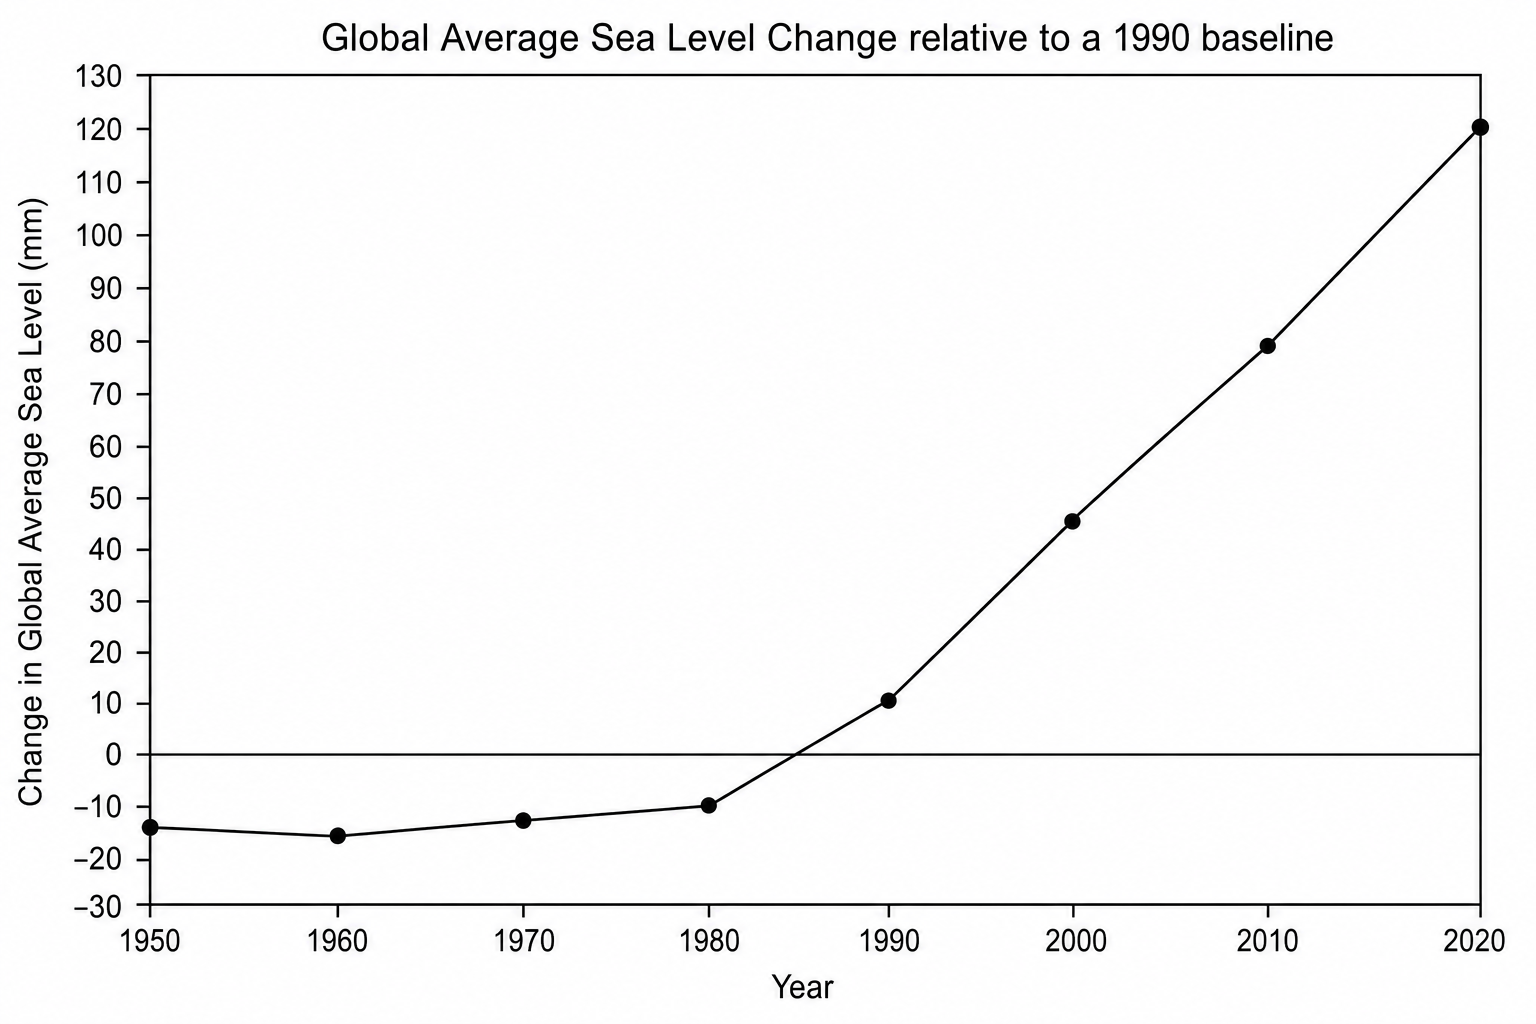
Figure 1
| Year | Change in Global Average Sea Level (mm) |
|---|---|
| 1950 | -20 |
| 1960 | -22 |
| 1970 | -20 |
| 1980 | -18 |
| 1990 | +10 |
| 2000 | +42 |
| 2010 | +78 |
| 2020 | +120 |
Using Figure 1, describe the trend in the global average sea level from:
a.[1]
1950 to 1980
b.[1]
1980 onwards
| Year | Change in Global Average Sea Level (mm) |
|---|---|
| 1950 | -20 |
| 1960 | -22 |
| 1970 | -20 |
| 1980 | -18 |
| 1990 | +10 |
| 2000 | +42 |
| 2010 | +78 |
| 2020 | +120 |
Using Figure 1, describe the trend in the global average sea level from:
1950 to 1980
1980 onwards