Skip to content
MathsGenie logo
Open app

Course home

  1. IGCSE
  2. Geography Edexcel
  3. Question bank

Economic activity and energy

EasyMediumHard
12345678910111213141516171819202122232425262728293031
Question 27

Study Figure 1c, which shows the percentage of the workforce employed in the secondary (manufacturing) sector in selected countries between 1990 and 2020.
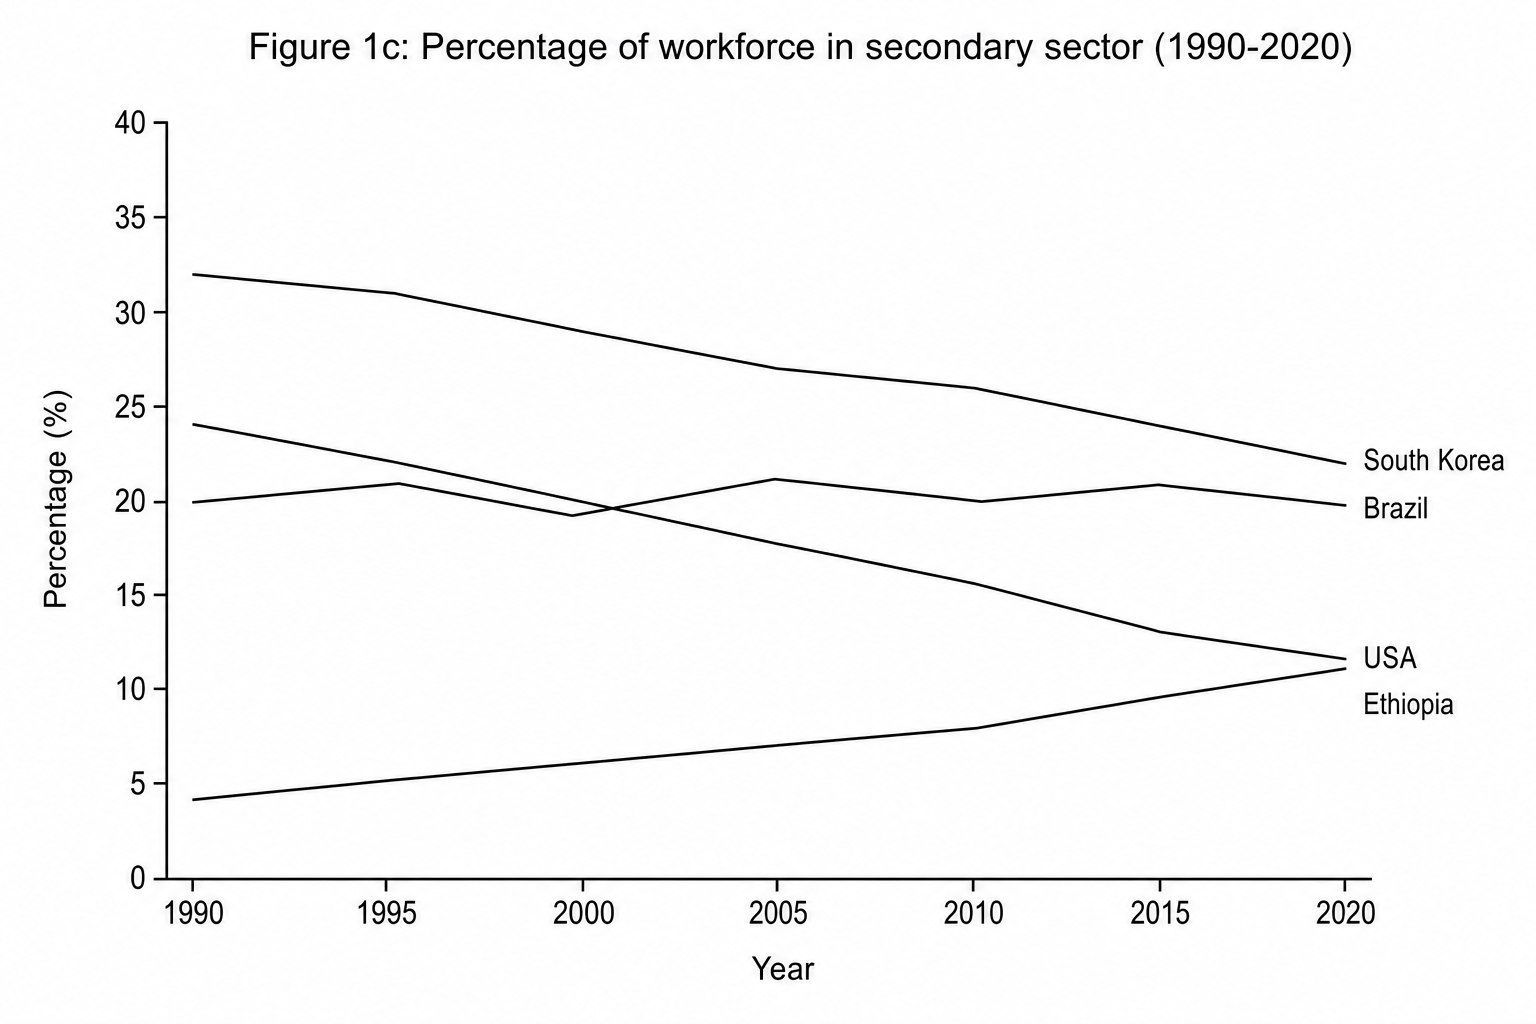
Figure 1c: Line graph showing the percentage (%) of the workforce in the secondary sector for Ethiopia, Brazil, South Korea, and the USA from 1990 to 2020.

Suggest one reason for the changes in secondary sector employment shown in a country of your choice.


[3]

Economic activity and energy Questions

  1. IGCSE
  2. /Geography
  3. /Economic activity and energy