Skip to content
MathsGenie logo
Open app

Course home

  1. IGCSE
  2. Geography Edexcel
  3. Question bank

Economic activity and energy

EasyMediumHard
1234567891011121314151617181920212223242526272829303132333435363738394041424344454647484950515253545556575859
Question 4

Context: Renewable Energy Planning

A local council is conducting a consultation regarding a proposed onshore wind farm project near three rural settlements: Highfield, Lowwood, and Oakridge.

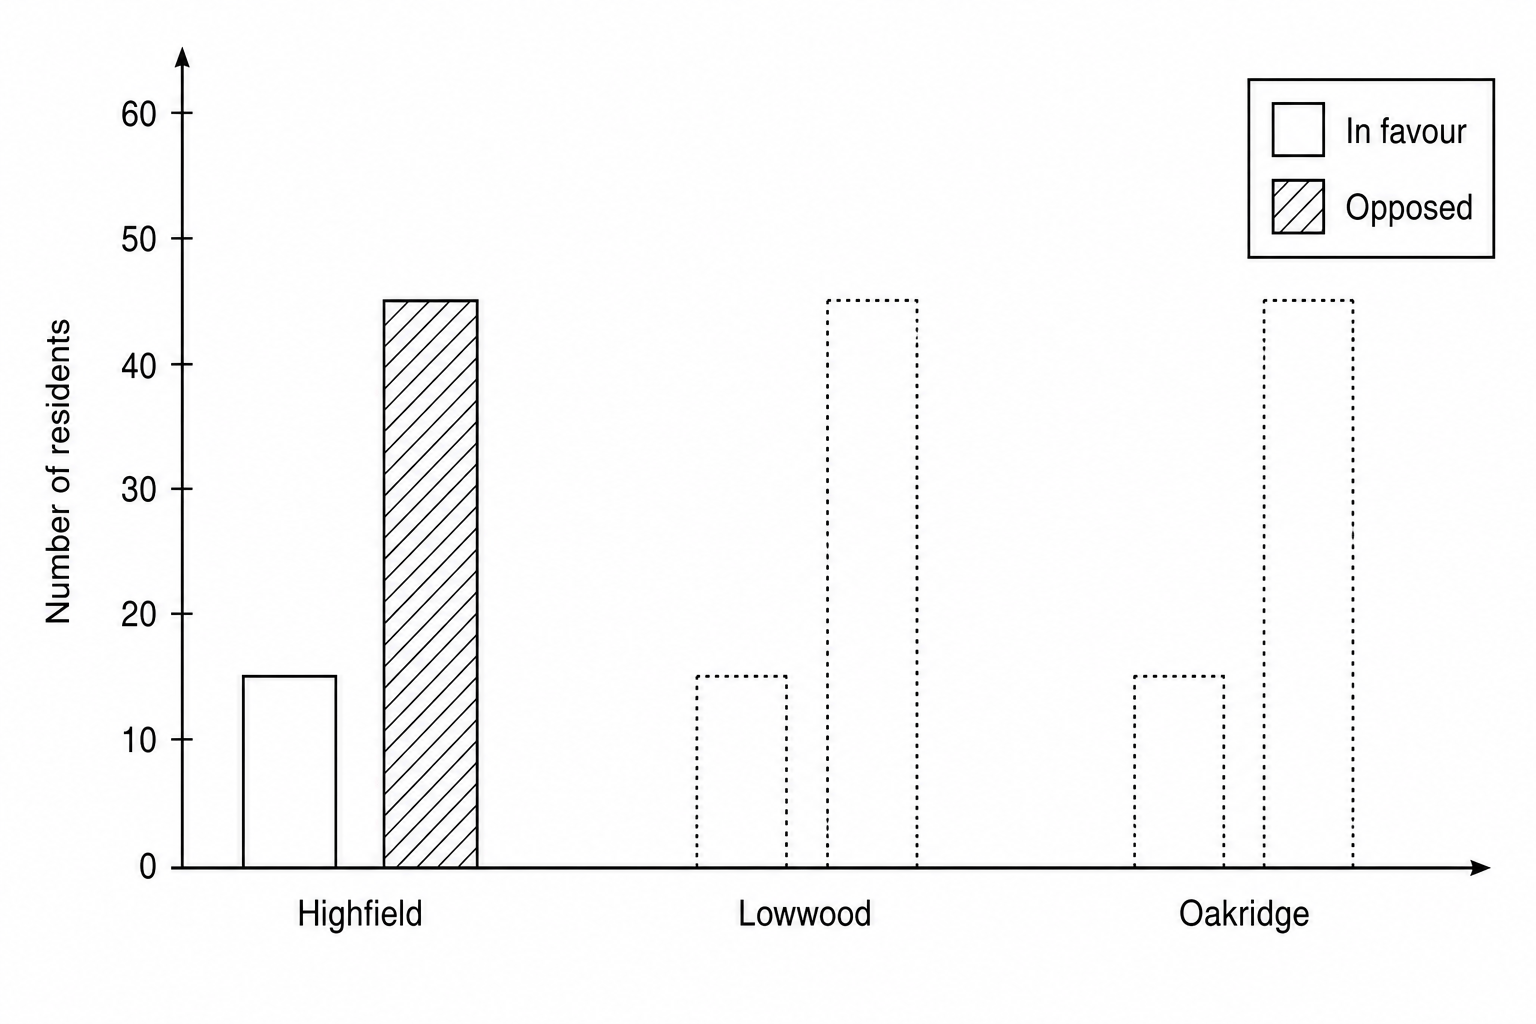
Figure 7a displays the results of a survey regarding local residents' opinions on the project.

Figure 7a: Survey results on the proposed wind farm

VillageHighfieldLowwoodOakridge
Number of residents in favour of the wind farm153550
Number of residents opposed to the wind farm452510
Total number of residents surveyed606060

Figure 7b: Bar chart template

A bar chart template showing public opinion on a proposed wind farm in three villages. The vertical y-axis is labeled 'Number of residents' and ranges from 0 to 60 in increments of 10. The horizontal x-axis shows three villages: Highfield, Lowwood, and Oakridge. For each village, there are spaces for two grouped bars: a shaded green bar representing 'In favour' and a diagonal-striped red bar representing 'Opposed'. Highfield's bars are already plotted (In favour = 15, Opposed = 45). The bars for Lowwood and Oakridge are blank templates awaiting completion.

Using the data in Figure 7a, complete the bar chart for the villages of Lowwood and Oakridge in Figure 7b.


[2]

Economic activity and energy Questions

  1. IGCSE
  2. /Geography
  3. /Economic activity and energy