Government and the economy

EasyMediumHard
123456789101112131415161718192021222324252627282930313233343536373839404142434445464748495051525354555657585960
Question 49
Easy

Figure 1 shows a stylized economic cycle (business cycle) over time with real GDP on the vertical axis and time on the horizontal axis. One stage, 'Recession', has already been labeled on the downward phase.

Using the diagram below, label the remaining three stages of the economic cycle corresponding to the boxes A, B, and C.
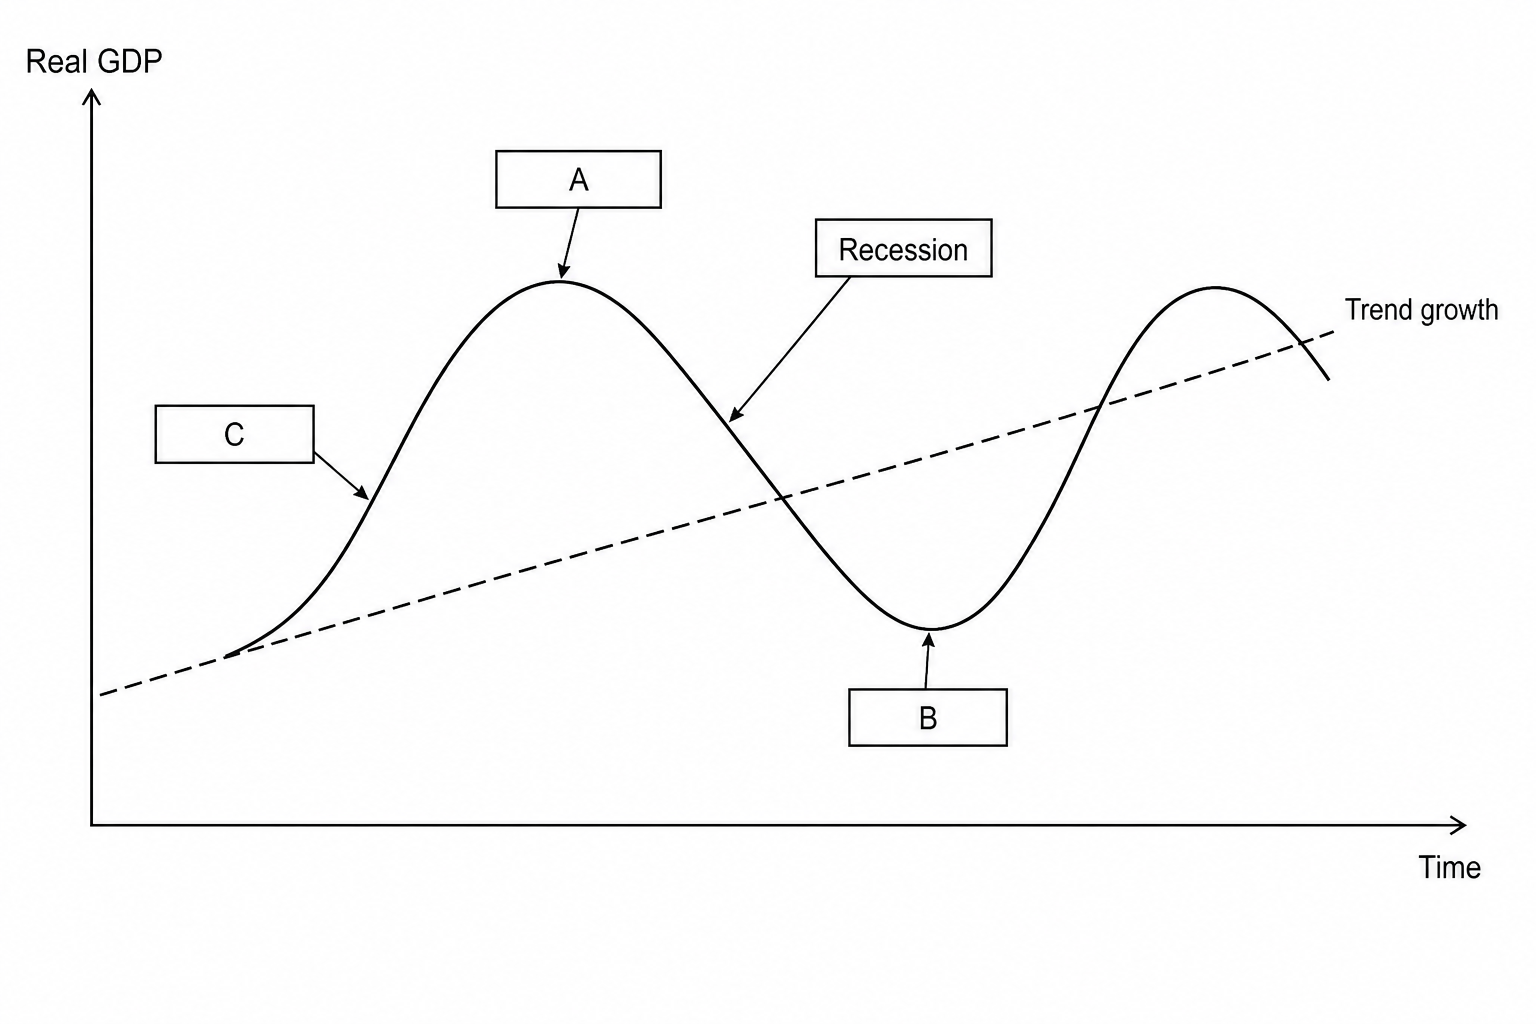
A graph showing the economic cycle with 'Real GDP' on the vertical axis and 'Time' on the horizontal axis. An upward-sloping dashed line represents 'Trend growth'. A solid wavy line representing actual GDP oscillates around the trend line. A box pointing to the downward-sloping section of the wave is labeled 'Recession'. There are three empty boxes: Box A points to the highest peak of the wavy line; Box B points to the lowest trough of the wavy line; Box C points to the upward-sloping section of the wavy line.

[3]

Government and the economy Questions

  1. IGCSE
  2. /Economics
  3. /Government and the economy