Government and the economy

EasyMediumHard
123456789101112131415161718192021222324252627282930313233343536373839404142434445464748495051525354555657585960
Question 46
Easy

Figure 1 below shows a stylized economic cycle (business cycle) oscillating around a long-run trend growth path.
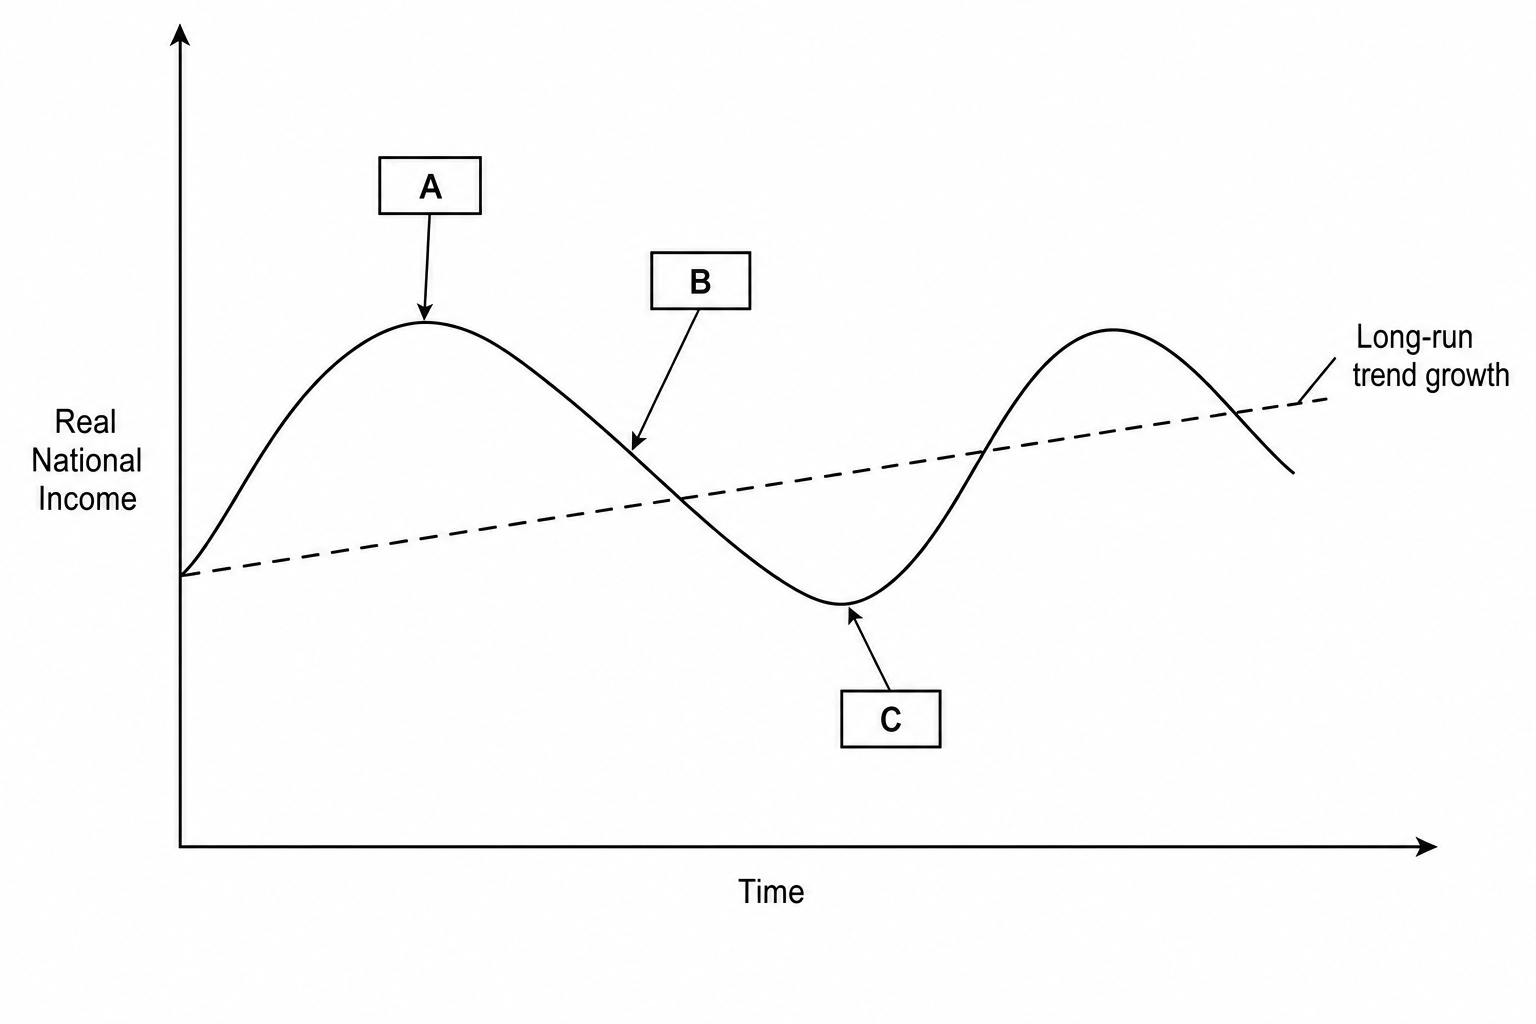
Figure 1: A line graph with Real National Income on the vertical axis and Time on the horizontal axis. A dashed straight line, labeled 'Long-run trend growth', slopes upwards from left to right. A solid wavy line oscillates above and below this trend line, representing the actual economic cycle. There are three empty rectangular boxes: Box A points directly to the highest peak of the wavy line; Box B points to the downward-sloping phase of the wavy line; Box C points to the lowest point (the valley) of the wavy line.

Identify the macroeconomic terms that correctly label the boxed stages A, B, and C on the diagram.

[3]

Government and the economy Questions

  1. IGCSE
  2. /Economics
  3. /Government and the economy