Question 1
35%The table gives information about the number of people staying in a hotel each quarter in 2011 and in 2012.
| Year | 2011 | 2012 | ||||||
|---|---|---|---|---|---|---|---|---|
| Quarter | 1 | 2 | 3 | 4 | 1 | 2 | 3 | 4 |
| Number of people | 261 | 353 | 372 | 290 | 193 | 309 | 292 | 202 |
a.[2]
Calculate the 4-point moving averages for this information.
The first three have been done for you.
319, 302, 291, ..... , .....
b.[2]
The information in the table is shown on the grid.
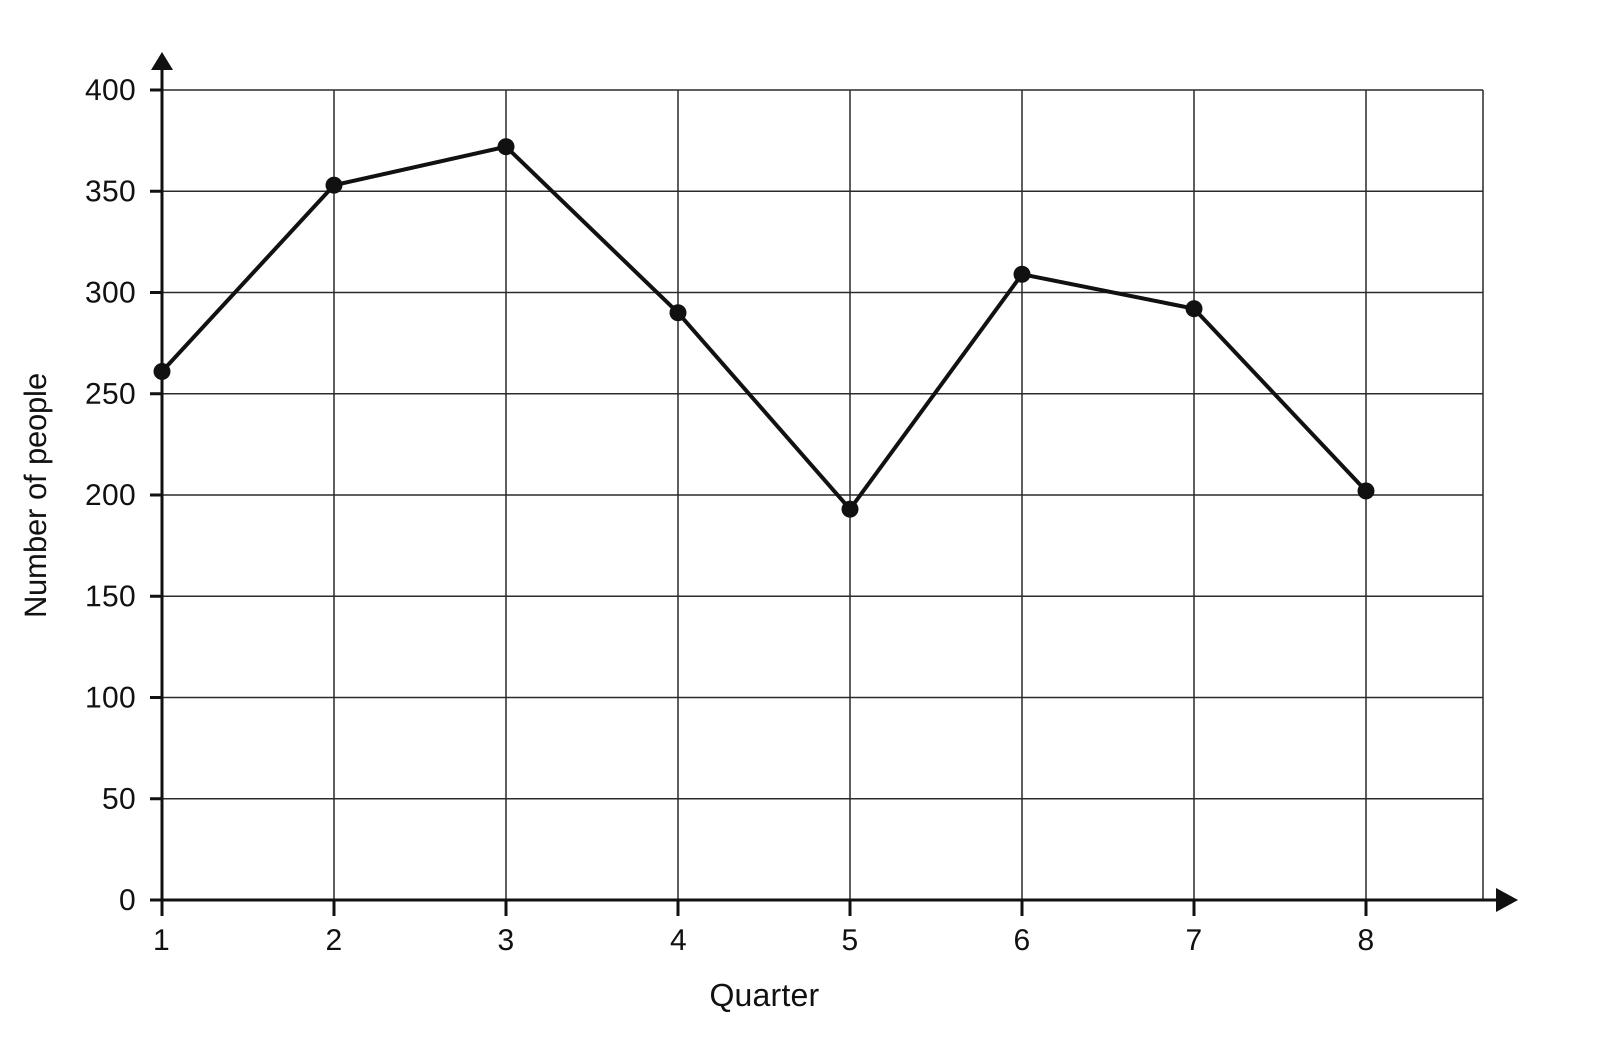
On the grid, plot the 4-point moving averages.
c.[1]
Describe what the moving averages show about the trend in the number of people staying at the hotel over this period.
Moving Averages Questions
5 exam-style questions on Edexcel GCSE Statistics Moving Averages. Each one has a worked solution and a mark scheme showing where the marks go.