The Normal Distribution
Question 1
50%A variable, XXX, has a normal distribution with mean 60
95% of the values of X X\,X lie between 45 and 75
a.[3]
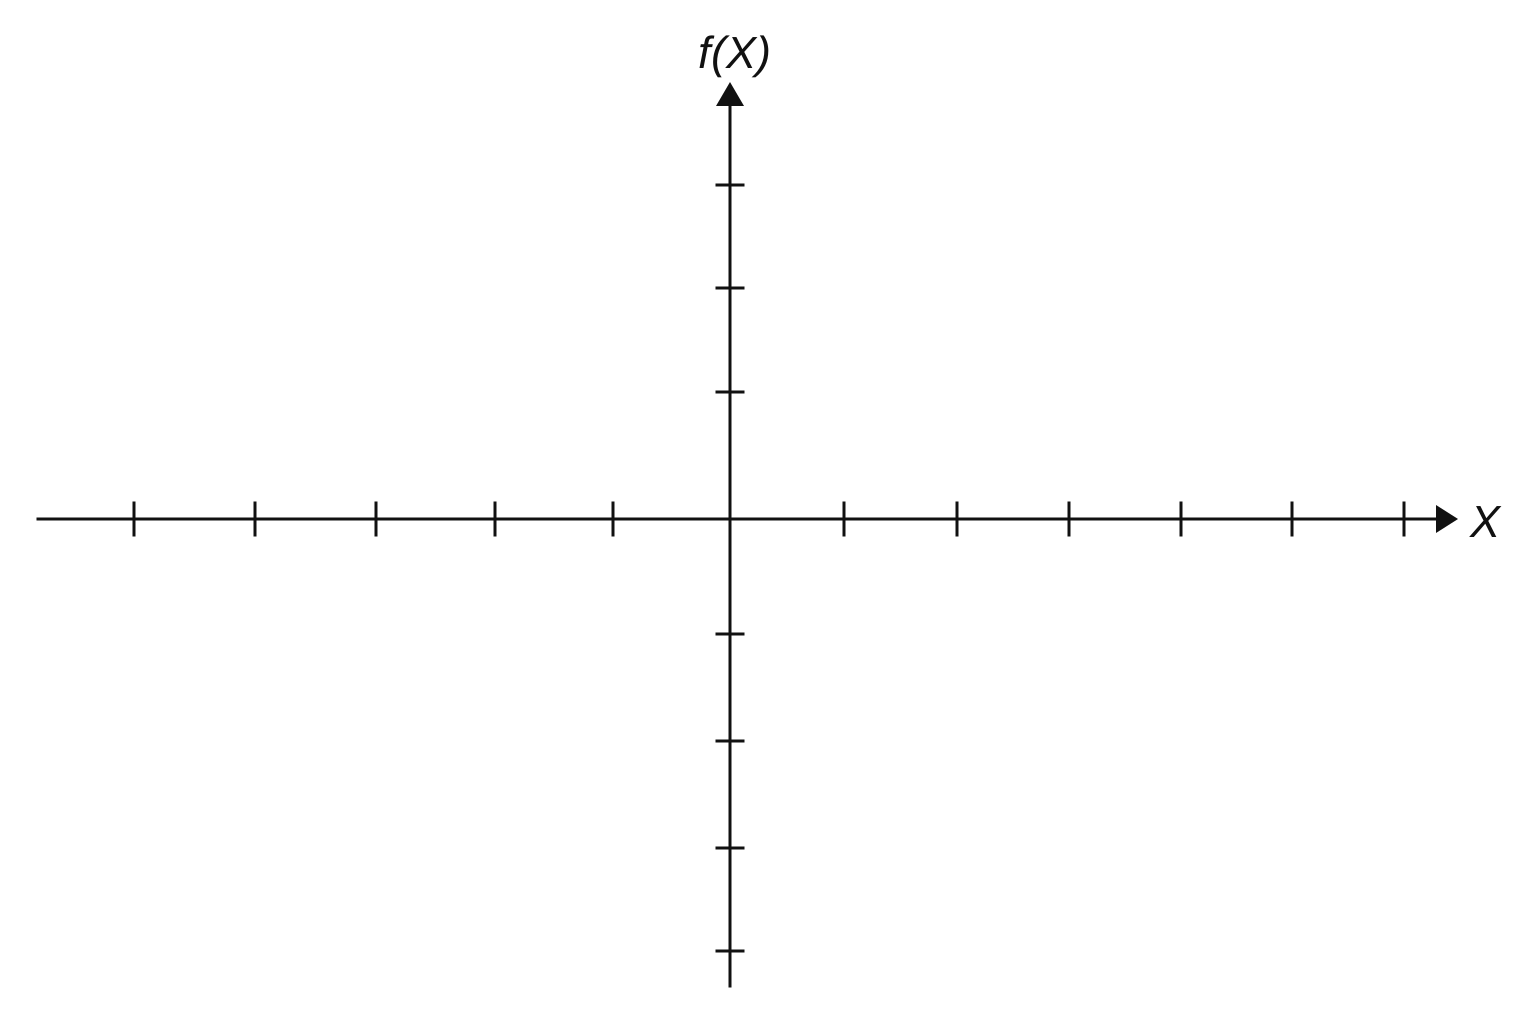
Sketch a diagram to show this distribution.
b.
[2]
Ross wants to find out how long it takes boys and girls in different year groups to complete jigsaw puzzles.
He collects the following information for each child.
| Gender |
| Year group |
| Number of pieces in the jigsaw puzzle |
| Time taken to complete the puzzle |
| Favourite subject |
Which of these variables is most likely to be modelled by a normal distribution? Give a reason for your answer.
The Normal Distribution Questions
1 exam-style question on Edexcel GCSE Statistics The Normal Distribution. Each one has a worked solution and a mark scheme showing where the marks go.